Immigrants from Dominica vs Immigrants from Latvia Single Mother Households
COMPARE
Immigrants from Dominica
Immigrants from Latvia
Single Mother Households
Single Mother Households Comparison
Immigrants from Dominica
Immigrants from Latvia
8.7%
SINGLE MOTHER HOUSEHOLDS
0.0/ 100
METRIC RATING
335th/ 347
METRIC RANK
5.5%
SINGLE MOTHER HOUSEHOLDS
99.2/ 100
METRIC RATING
49th/ 347
METRIC RANK
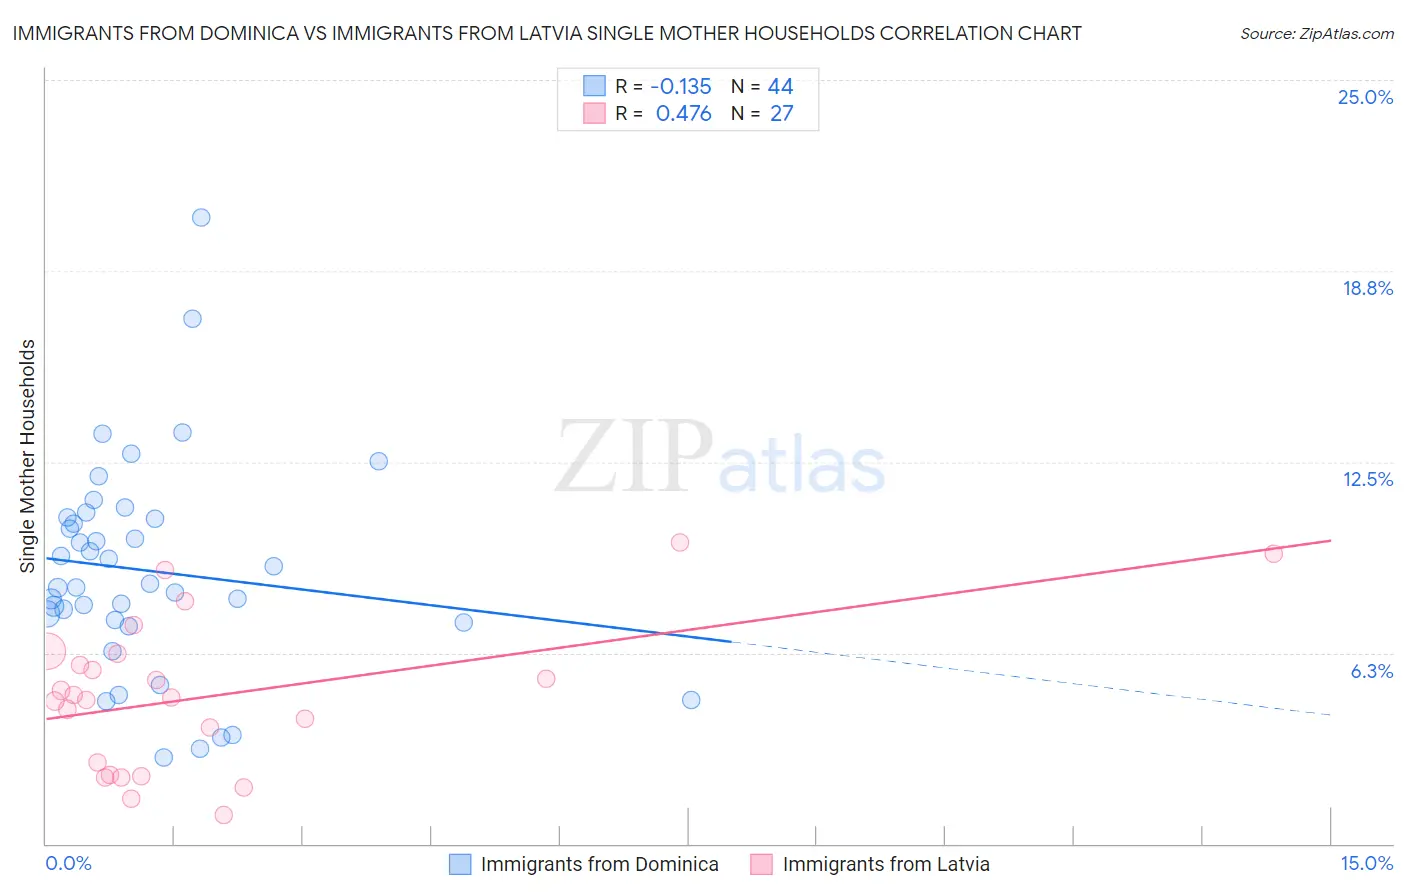
Immigrants from Dominica vs Immigrants from Latvia Single Mother Households Correlation Chart
The statistical analysis conducted on geographies consisting of 83,777,287 people shows a poor negative correlation between the proportion of Immigrants from Dominica and percentage of single mother households in the United States with a correlation coefficient (R) of -0.135 and weighted average of 8.7%. Similarly, the statistical analysis conducted on geographies consisting of 113,660,661 people shows a moderate positive correlation between the proportion of Immigrants from Latvia and percentage of single mother households in the United States with a correlation coefficient (R) of 0.476 and weighted average of 5.5%, a difference of 59.5%.
Single Mother Households Correlation Summary
| Measurement | Immigrants from Dominica | Immigrants from Latvia |
| Minimum | 2.8% | 0.94% |
| Maximum | 20.5% | 9.9% |
| Range | 17.7% | 8.9% |
| Mean | 8.9% | 4.8% |
| Median | 8.5% | 4.8% |
| Interquartile 25% (IQ1) | 7.3% | 2.3% |
| Interquartile 75% (IQ3) | 10.7% | 6.2% |
| Interquartile Range (IQR) | 3.4% | 4.0% |
| Standard Deviation (Sample) | 3.5% | 2.4% |
| Standard Deviation (Population) | 3.5% | 2.4% |
Similar Demographics by Single Mother Households
Demographics Similar to Immigrants from Dominica by Single Mother Households
In terms of single mother households, the demographic groups most similar to Immigrants from Dominica are Puerto Rican (8.7%, a difference of 0.040%), Immigrants from Liberia (8.7%, a difference of 0.29%), Liberian (8.6%, a difference of 1.1%), Navajo (8.8%, a difference of 1.2%), and Cape Verdean (8.9%, a difference of 1.3%).
| Demographics | Rating | Rank | Single Mother Households |
| Yakama | 0.0 /100 | #328 | Tragic 8.4% |
| Hopi | 0.0 /100 | #329 | Tragic 8.5% |
| Inupiat | 0.0 /100 | #330 | Tragic 8.5% |
| Sioux | 0.0 /100 | #331 | Tragic 8.5% |
| U.S. Virgin Islanders | 0.0 /100 | #332 | Tragic 8.6% |
| Liberians | 0.0 /100 | #333 | Tragic 8.6% |
| Immigrants | Liberia | 0.0 /100 | #334 | Tragic 8.7% |
| Immigrants | Dominica | 0.0 /100 | #335 | Tragic 8.7% |
| Puerto Ricans | 0.0 /100 | #336 | Tragic 8.7% |
| Navajo | 0.0 /100 | #337 | Tragic 8.8% |
| Cape Verdeans | 0.0 /100 | #338 | Tragic 8.9% |
| Blacks/African Americans | 0.0 /100 | #339 | Tragic 9.0% |
| Lumbee | 0.0 /100 | #340 | Tragic 9.1% |
| Tohono O'odham | 0.0 /100 | #341 | Tragic 9.1% |
| Menominee | 0.0 /100 | #342 | Tragic 9.2% |
Demographics Similar to Immigrants from Latvia by Single Mother Households
In terms of single mother households, the demographic groups most similar to Immigrants from Latvia are Turkish (5.5%, a difference of 0.030%), Immigrants from Scotland (5.5%, a difference of 0.19%), Immigrants from Belarus (5.5%, a difference of 0.21%), Norwegian (5.5%, a difference of 0.23%), and Swedish (5.5%, a difference of 0.27%).
| Demographics | Rating | Rank | Single Mother Households |
| Macedonians | 99.5 /100 | #42 | Exceptional 5.4% |
| Immigrants | South Central Asia | 99.5 /100 | #43 | Exceptional 5.4% |
| Lithuanians | 99.4 /100 | #44 | Exceptional 5.4% |
| Immigrants | Croatia | 99.4 /100 | #45 | Exceptional 5.4% |
| Croatians | 99.3 /100 | #46 | Exceptional 5.5% |
| Norwegians | 99.3 /100 | #47 | Exceptional 5.5% |
| Turks | 99.2 /100 | #48 | Exceptional 5.5% |
| Immigrants | Latvia | 99.2 /100 | #49 | Exceptional 5.5% |
| Immigrants | Scotland | 99.2 /100 | #50 | Exceptional 5.5% |
| Immigrants | Belarus | 99.2 /100 | #51 | Exceptional 5.5% |
| Swedes | 99.1 /100 | #52 | Exceptional 5.5% |
| Immigrants | Russia | 99.1 /100 | #53 | Exceptional 5.5% |
| Immigrants | Lebanon | 99.1 /100 | #54 | Exceptional 5.5% |
| Immigrants | Denmark | 99.1 /100 | #55 | Exceptional 5.5% |
| Immigrants | Romania | 99.0 /100 | #56 | Exceptional 5.5% |