Potawatomi vs Creek Single Mother Households
COMPARE
Potawatomi
Creek
Single Mother Households
Single Mother Households Comparison
Potawatomi
Creek
6.6%
SINGLE MOTHER HOUSEHOLDS
15.5/ 100
METRIC RATING
199th/ 347
METRIC RANK
7.0%
SINGLE MOTHER HOUSEHOLDS
1.6/ 100
METRIC RATING
230th/ 347
METRIC RANK
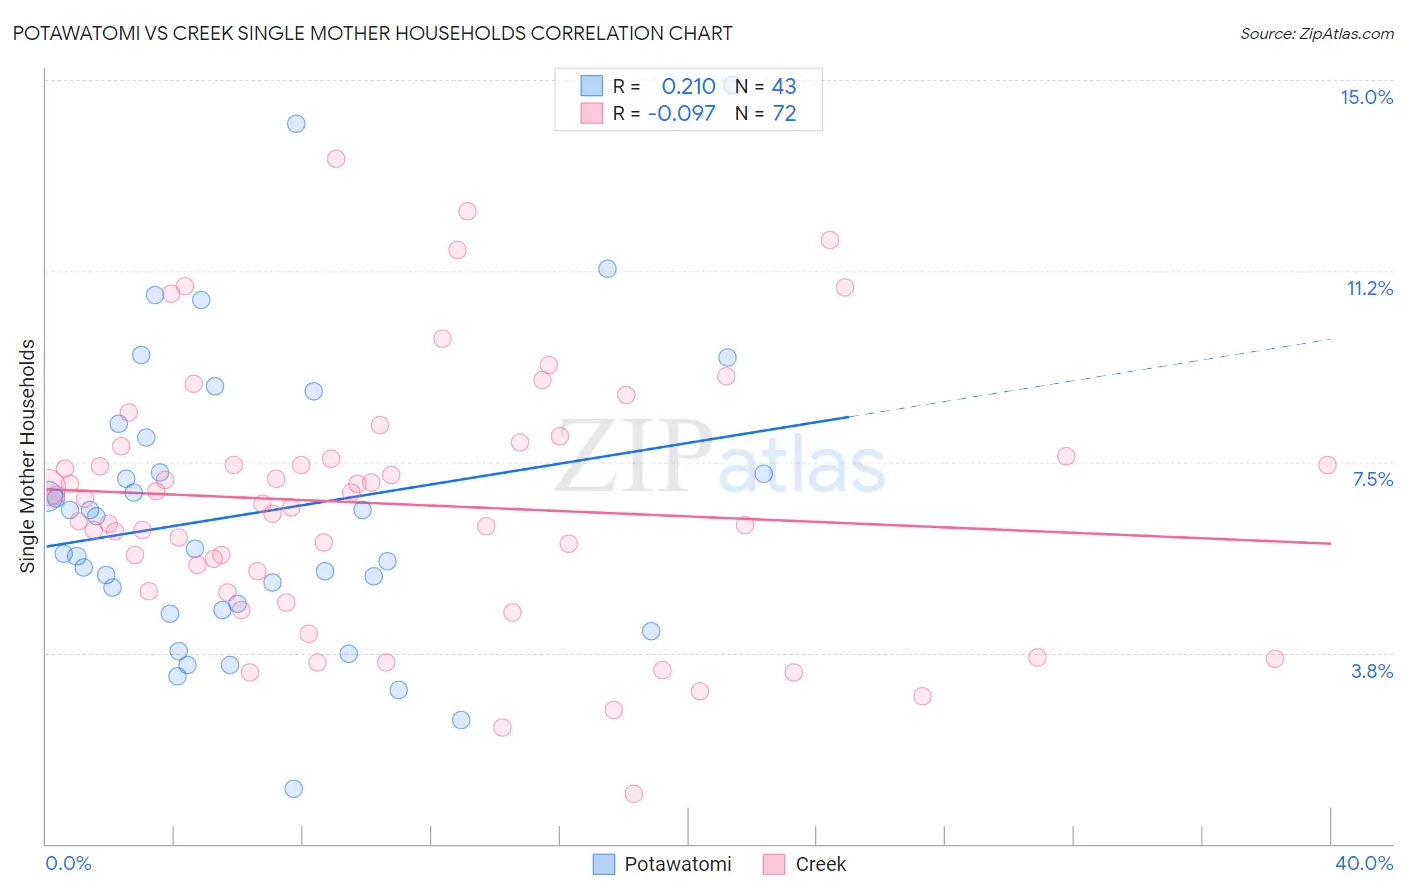
Potawatomi vs Creek Single Mother Households Correlation Chart
The statistical analysis conducted on geographies consisting of 117,659,768 people shows a weak positive correlation between the proportion of Potawatomi and percentage of single mother households in the United States with a correlation coefficient (R) of 0.210 and weighted average of 6.6%. Similarly, the statistical analysis conducted on geographies consisting of 178,256,539 people shows a slight negative correlation between the proportion of Creek and percentage of single mother households in the United States with a correlation coefficient (R) of -0.097 and weighted average of 7.0%, a difference of 6.4%.
Single Mother Households Correlation Summary
| Measurement | Potawatomi | Creek |
| Minimum | 1.1% | 0.97% |
| Maximum | 14.9% | 13.4% |
| Range | 13.8% | 12.5% |
| Mean | 6.5% | 6.7% |
| Median | 5.8% | 6.7% |
| Interquartile 25% (IQ1) | 4.6% | 5.1% |
| Interquartile 75% (IQ3) | 8.0% | 7.7% |
| Interquartile Range (IQR) | 3.4% | 2.6% |
| Standard Deviation (Sample) | 2.9% | 2.5% |
| Standard Deviation (Population) | 2.9% | 2.5% |
Similar Demographics by Single Mother Households
Demographics Similar to Potawatomi by Single Mother Households
In terms of single mother households, the demographic groups most similar to Potawatomi are Hawaiian (6.6%, a difference of 0.11%), Immigrants from Ethiopia (6.6%, a difference of 0.16%), Moroccan (6.6%, a difference of 0.36%), South American (6.6%, a difference of 0.47%), and Uruguayan (6.6%, a difference of 0.47%).
| Demographics | Rating | Rank | Single Mother Households |
| Americans | 19.0 /100 | #192 | Poor 6.6% |
| Colombians | 18.3 /100 | #193 | Poor 6.6% |
| Immigrants | Uganda | 18.3 /100 | #194 | Poor 6.6% |
| South Americans | 18.0 /100 | #195 | Poor 6.6% |
| Uruguayans | 18.0 /100 | #196 | Poor 6.6% |
| Moroccans | 17.4 /100 | #197 | Poor 6.6% |
| Hawaiians | 16.1 /100 | #198 | Poor 6.6% |
| Potawatomi | 15.5 /100 | #199 | Poor 6.6% |
| Immigrants | Ethiopia | 14.7 /100 | #200 | Poor 6.6% |
| Venezuelans | 12.9 /100 | #201 | Poor 6.6% |
| Guamanians/Chamorros | 12.4 /100 | #202 | Poor 6.6% |
| Immigrants | Peru | 12.0 /100 | #203 | Poor 6.7% |
| Immigrants | Fiji | 11.9 /100 | #204 | Poor 6.7% |
| Cree | 11.9 /100 | #205 | Poor 6.7% |
| German Russians | 11.5 /100 | #206 | Poor 6.7% |
Demographics Similar to Creek by Single Mother Households
In terms of single mother households, the demographic groups most similar to Creek are Spanish American (7.0%, a difference of 0.020%), Comanche (7.0%, a difference of 0.080%), Choctaw (7.0%, a difference of 0.25%), Chickasaw (7.0%, a difference of 0.27%), and Immigrants from Burma/Myanmar (7.0%, a difference of 0.34%).
| Demographics | Rating | Rank | Single Mother Households |
| Immigrants | Micronesia | 3.6 /100 | #223 | Tragic 6.9% |
| Immigrants | Sudan | 3.5 /100 | #224 | Tragic 6.9% |
| Sudanese | 3.1 /100 | #225 | Tragic 6.9% |
| Paiute | 2.4 /100 | #226 | Tragic 7.0% |
| Kenyans | 2.3 /100 | #227 | Tragic 7.0% |
| Iroquois | 2.2 /100 | #228 | Tragic 7.0% |
| Immigrants | Kenya | 2.1 /100 | #229 | Tragic 7.0% |
| Creek | 1.6 /100 | #230 | Tragic 7.0% |
| Spanish Americans | 1.6 /100 | #231 | Tragic 7.0% |
| Comanche | 1.5 /100 | #232 | Tragic 7.0% |
| Choctaw | 1.4 /100 | #233 | Tragic 7.0% |
| Chickasaw | 1.4 /100 | #234 | Tragic 7.0% |
| Immigrants | Burma/Myanmar | 1.4 /100 | #235 | Tragic 7.0% |
| Ute | 1.0 /100 | #236 | Tragic 7.1% |
| Arapaho | 1.0 /100 | #237 | Tragic 7.1% |