Hopi vs Creek Single Mother Households
COMPARE
Hopi
Creek
Single Mother Households
Single Mother Households Comparison
Hopi
Creek
8.5%
SINGLE MOTHER HOUSEHOLDS
0.0/ 100
METRIC RATING
329th/ 347
METRIC RANK
7.0%
SINGLE MOTHER HOUSEHOLDS
1.6/ 100
METRIC RATING
230th/ 347
METRIC RANK
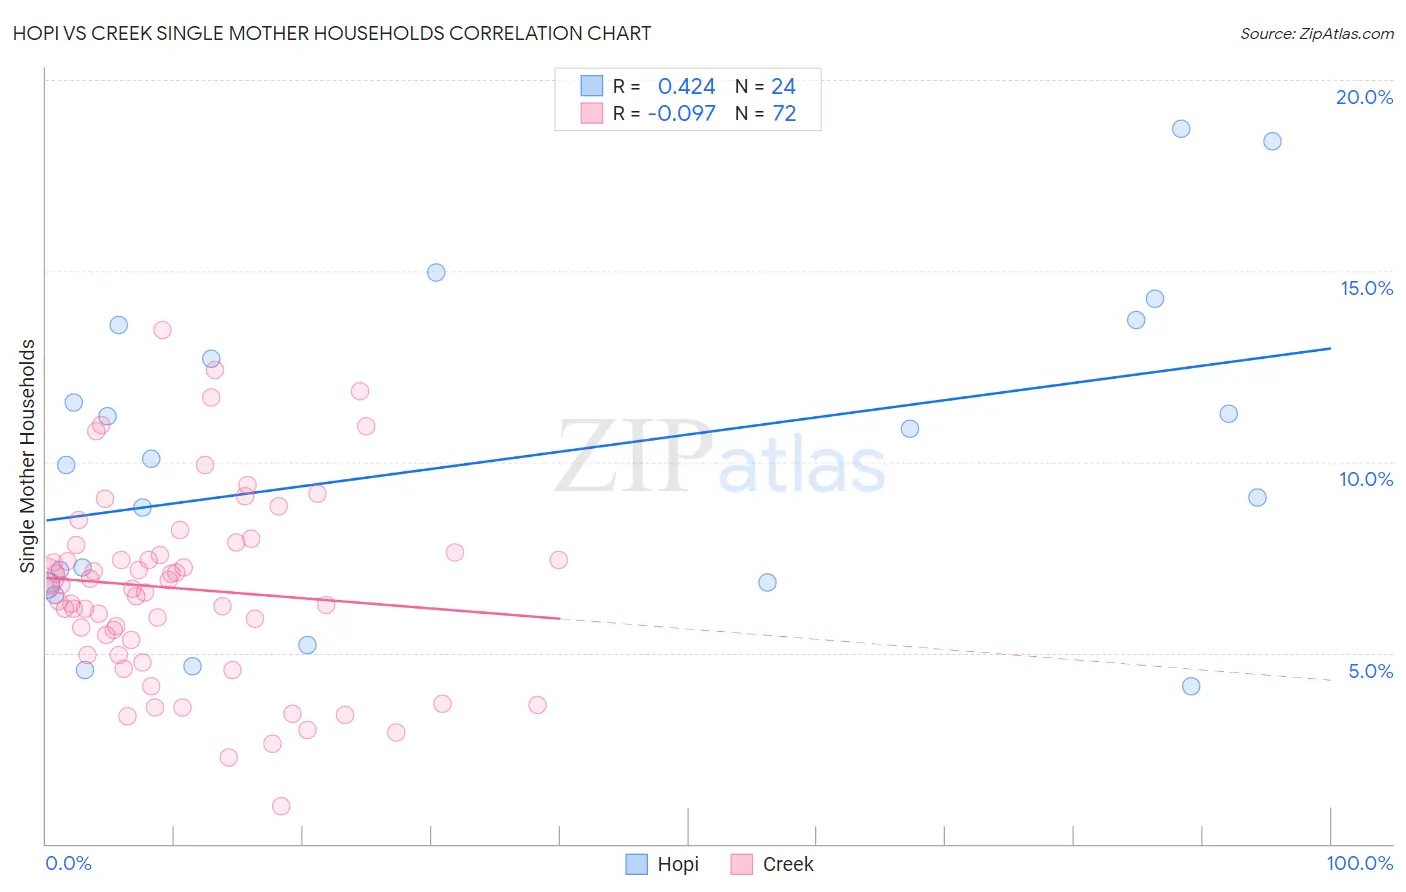
Hopi vs Creek Single Mother Households Correlation Chart
The statistical analysis conducted on geographies consisting of 74,699,653 people shows a moderate positive correlation between the proportion of Hopi and percentage of single mother households in the United States with a correlation coefficient (R) of 0.424 and weighted average of 8.5%. Similarly, the statistical analysis conducted on geographies consisting of 178,256,539 people shows a slight negative correlation between the proportion of Creek and percentage of single mother households in the United States with a correlation coefficient (R) of -0.097 and weighted average of 7.0%, a difference of 20.6%.
Single Mother Households Correlation Summary
| Measurement | Hopi | Creek |
| Minimum | 4.1% | 0.97% |
| Maximum | 18.7% | 13.4% |
| Range | 14.6% | 12.5% |
| Mean | 10.1% | 6.7% |
| Median | 10.0% | 6.7% |
| Interquartile 25% (IQ1) | 6.8% | 5.1% |
| Interquartile 75% (IQ3) | 13.1% | 7.7% |
| Interquartile Range (IQR) | 6.4% | 2.6% |
| Standard Deviation (Sample) | 4.2% | 2.5% |
| Standard Deviation (Population) | 4.1% | 2.5% |
Similar Demographics by Single Mother Households
Demographics Similar to Hopi by Single Mother Households
In terms of single mother households, the demographic groups most similar to Hopi are Inupiat (8.5%, a difference of 0.11%), Sioux (8.5%, a difference of 0.11%), Yakama (8.4%, a difference of 0.75%), Immigrants from Haiti (8.4%, a difference of 0.92%), and British West Indian (8.4%, a difference of 1.1%).
| Demographics | Rating | Rank | Single Mother Households |
| Pima | 0.0 /100 | #322 | Tragic 8.3% |
| Haitians | 0.0 /100 | #323 | Tragic 8.3% |
| Immigrants | Jamaica | 0.0 /100 | #324 | Tragic 8.4% |
| Immigrants | Caribbean | 0.0 /100 | #325 | Tragic 8.4% |
| British West Indians | 0.0 /100 | #326 | Tragic 8.4% |
| Immigrants | Haiti | 0.0 /100 | #327 | Tragic 8.4% |
| Yakama | 0.0 /100 | #328 | Tragic 8.4% |
| Hopi | 0.0 /100 | #329 | Tragic 8.5% |
| Inupiat | 0.0 /100 | #330 | Tragic 8.5% |
| Sioux | 0.0 /100 | #331 | Tragic 8.5% |
| U.S. Virgin Islanders | 0.0 /100 | #332 | Tragic 8.6% |
| Liberians | 0.0 /100 | #333 | Tragic 8.6% |
| Immigrants | Liberia | 0.0 /100 | #334 | Tragic 8.7% |
| Immigrants | Dominica | 0.0 /100 | #335 | Tragic 8.7% |
| Puerto Ricans | 0.0 /100 | #336 | Tragic 8.7% |
Demographics Similar to Creek by Single Mother Households
In terms of single mother households, the demographic groups most similar to Creek are Spanish American (7.0%, a difference of 0.020%), Comanche (7.0%, a difference of 0.080%), Choctaw (7.0%, a difference of 0.25%), Chickasaw (7.0%, a difference of 0.27%), and Immigrants from Burma/Myanmar (7.0%, a difference of 0.34%).
| Demographics | Rating | Rank | Single Mother Households |
| Immigrants | Micronesia | 3.6 /100 | #223 | Tragic 6.9% |
| Immigrants | Sudan | 3.5 /100 | #224 | Tragic 6.9% |
| Sudanese | 3.1 /100 | #225 | Tragic 6.9% |
| Paiute | 2.4 /100 | #226 | Tragic 7.0% |
| Kenyans | 2.3 /100 | #227 | Tragic 7.0% |
| Iroquois | 2.2 /100 | #228 | Tragic 7.0% |
| Immigrants | Kenya | 2.1 /100 | #229 | Tragic 7.0% |
| Creek | 1.6 /100 | #230 | Tragic 7.0% |
| Spanish Americans | 1.6 /100 | #231 | Tragic 7.0% |
| Comanche | 1.5 /100 | #232 | Tragic 7.0% |
| Choctaw | 1.4 /100 | #233 | Tragic 7.0% |
| Chickasaw | 1.4 /100 | #234 | Tragic 7.0% |
| Immigrants | Burma/Myanmar | 1.4 /100 | #235 | Tragic 7.0% |
| Ute | 1.0 /100 | #236 | Tragic 7.1% |
| Arapaho | 1.0 /100 | #237 | Tragic 7.1% |