Croatian vs Creek Single Mother Households
COMPARE
Croatian
Creek
Single Mother Households
Single Mother Households Comparison
Croatians
Creek
5.5%
SINGLE MOTHER HOUSEHOLDS
99.3/ 100
METRIC RATING
46th/ 347
METRIC RANK
7.0%
SINGLE MOTHER HOUSEHOLDS
1.6/ 100
METRIC RATING
230th/ 347
METRIC RANK
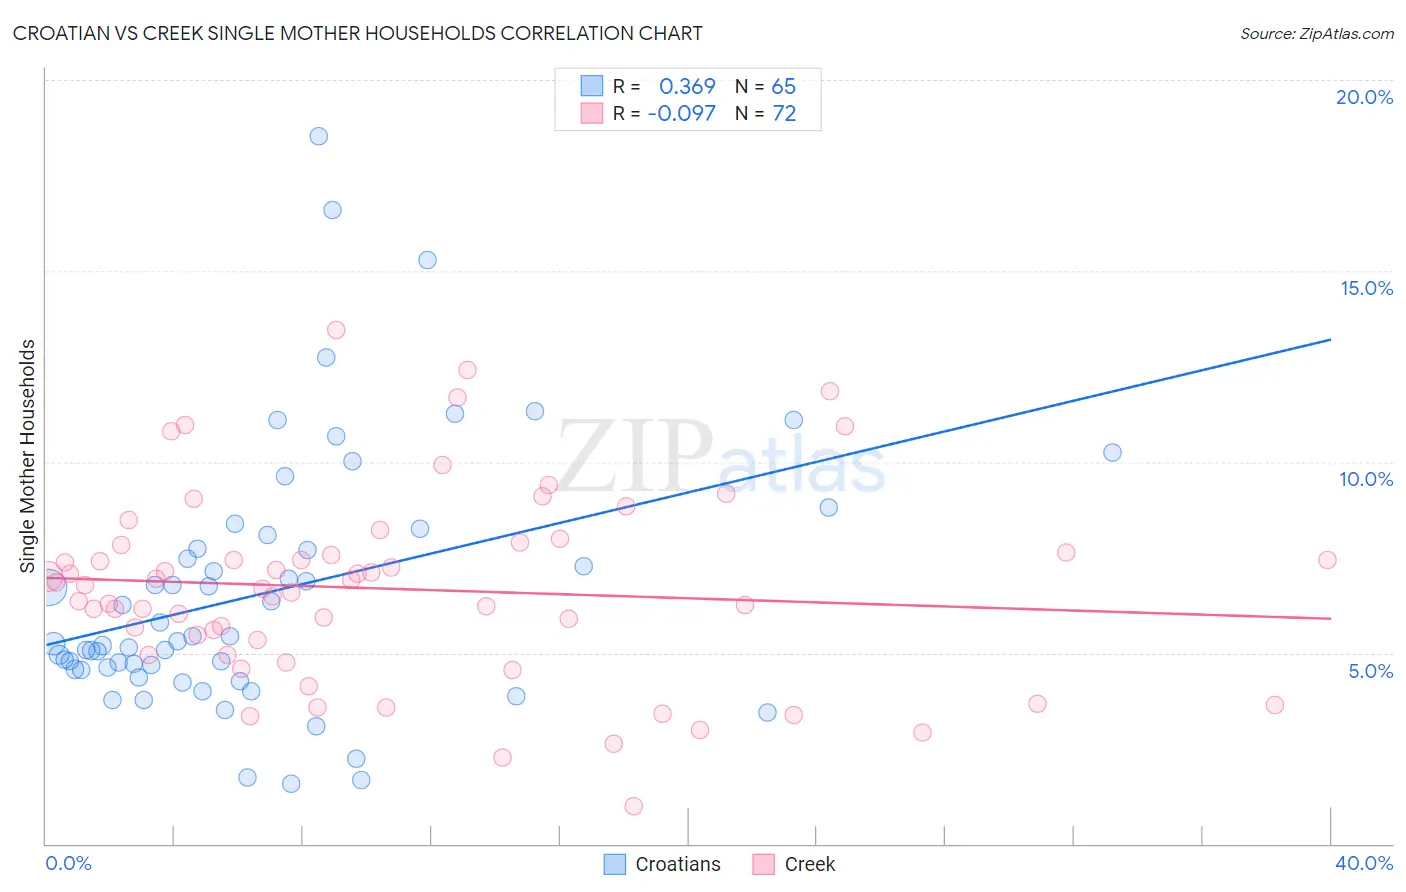
Croatian vs Creek Single Mother Households Correlation Chart
The statistical analysis conducted on geographies consisting of 374,465,881 people shows a mild positive correlation between the proportion of Croatians and percentage of single mother households in the United States with a correlation coefficient (R) of 0.369 and weighted average of 5.5%. Similarly, the statistical analysis conducted on geographies consisting of 178,256,539 people shows a slight negative correlation between the proportion of Creek and percentage of single mother households in the United States with a correlation coefficient (R) of -0.097 and weighted average of 7.0%, a difference of 28.8%.
Single Mother Households Correlation Summary
| Measurement | Croatian | Creek |
| Minimum | 1.6% | 0.97% |
| Maximum | 18.5% | 13.4% |
| Range | 16.9% | 12.5% |
| Mean | 6.6% | 6.7% |
| Median | 5.3% | 6.7% |
| Interquartile 25% (IQ1) | 4.6% | 5.1% |
| Interquartile 75% (IQ3) | 7.9% | 7.7% |
| Interquartile Range (IQR) | 3.4% | 2.6% |
| Standard Deviation (Sample) | 3.4% | 2.5% |
| Standard Deviation (Population) | 3.4% | 2.5% |
Similar Demographics by Single Mother Households
Demographics Similar to Croatians by Single Mother Households
In terms of single mother households, the demographic groups most similar to Croatians are Norwegian (5.5%, a difference of 0.18%), Immigrants from Croatia (5.4%, a difference of 0.26%), Lithuanian (5.4%, a difference of 0.38%), Turkish (5.5%, a difference of 0.38%), and Immigrants from Latvia (5.5%, a difference of 0.41%).
| Demographics | Rating | Rank | Single Mother Households |
| Immigrants | Sweden | 99.6 /100 | #39 | Exceptional 5.4% |
| Estonians | 99.6 /100 | #40 | Exceptional 5.4% |
| Immigrants | Greece | 99.5 /100 | #41 | Exceptional 5.4% |
| Macedonians | 99.5 /100 | #42 | Exceptional 5.4% |
| Immigrants | South Central Asia | 99.5 /100 | #43 | Exceptional 5.4% |
| Lithuanians | 99.4 /100 | #44 | Exceptional 5.4% |
| Immigrants | Croatia | 99.4 /100 | #45 | Exceptional 5.4% |
| Croatians | 99.3 /100 | #46 | Exceptional 5.5% |
| Norwegians | 99.3 /100 | #47 | Exceptional 5.5% |
| Turks | 99.2 /100 | #48 | Exceptional 5.5% |
| Immigrants | Latvia | 99.2 /100 | #49 | Exceptional 5.5% |
| Immigrants | Scotland | 99.2 /100 | #50 | Exceptional 5.5% |
| Immigrants | Belarus | 99.2 /100 | #51 | Exceptional 5.5% |
| Swedes | 99.1 /100 | #52 | Exceptional 5.5% |
| Immigrants | Russia | 99.1 /100 | #53 | Exceptional 5.5% |
Demographics Similar to Creek by Single Mother Households
In terms of single mother households, the demographic groups most similar to Creek are Spanish American (7.0%, a difference of 0.020%), Comanche (7.0%, a difference of 0.080%), Choctaw (7.0%, a difference of 0.25%), Chickasaw (7.0%, a difference of 0.27%), and Immigrants from Burma/Myanmar (7.0%, a difference of 0.34%).
| Demographics | Rating | Rank | Single Mother Households |
| Immigrants | Micronesia | 3.6 /100 | #223 | Tragic 6.9% |
| Immigrants | Sudan | 3.5 /100 | #224 | Tragic 6.9% |
| Sudanese | 3.1 /100 | #225 | Tragic 6.9% |
| Paiute | 2.4 /100 | #226 | Tragic 7.0% |
| Kenyans | 2.3 /100 | #227 | Tragic 7.0% |
| Iroquois | 2.2 /100 | #228 | Tragic 7.0% |
| Immigrants | Kenya | 2.1 /100 | #229 | Tragic 7.0% |
| Creek | 1.6 /100 | #230 | Tragic 7.0% |
| Spanish Americans | 1.6 /100 | #231 | Tragic 7.0% |
| Comanche | 1.5 /100 | #232 | Tragic 7.0% |
| Choctaw | 1.4 /100 | #233 | Tragic 7.0% |
| Chickasaw | 1.4 /100 | #234 | Tragic 7.0% |
| Immigrants | Burma/Myanmar | 1.4 /100 | #235 | Tragic 7.0% |
| Ute | 1.0 /100 | #236 | Tragic 7.1% |
| Arapaho | 1.0 /100 | #237 | Tragic 7.1% |