Senegalese vs Creek 8th Grade
COMPARE
Senegalese
Creek
8th Grade
8th Grade Comparison
Senegalese
Creek
95.2%
8TH GRADE
2.7/ 100
METRIC RATING
236th/ 347
METRIC RANK
96.6%
8TH GRADE
99.7/ 100
METRIC RATING
68th/ 347
METRIC RANK
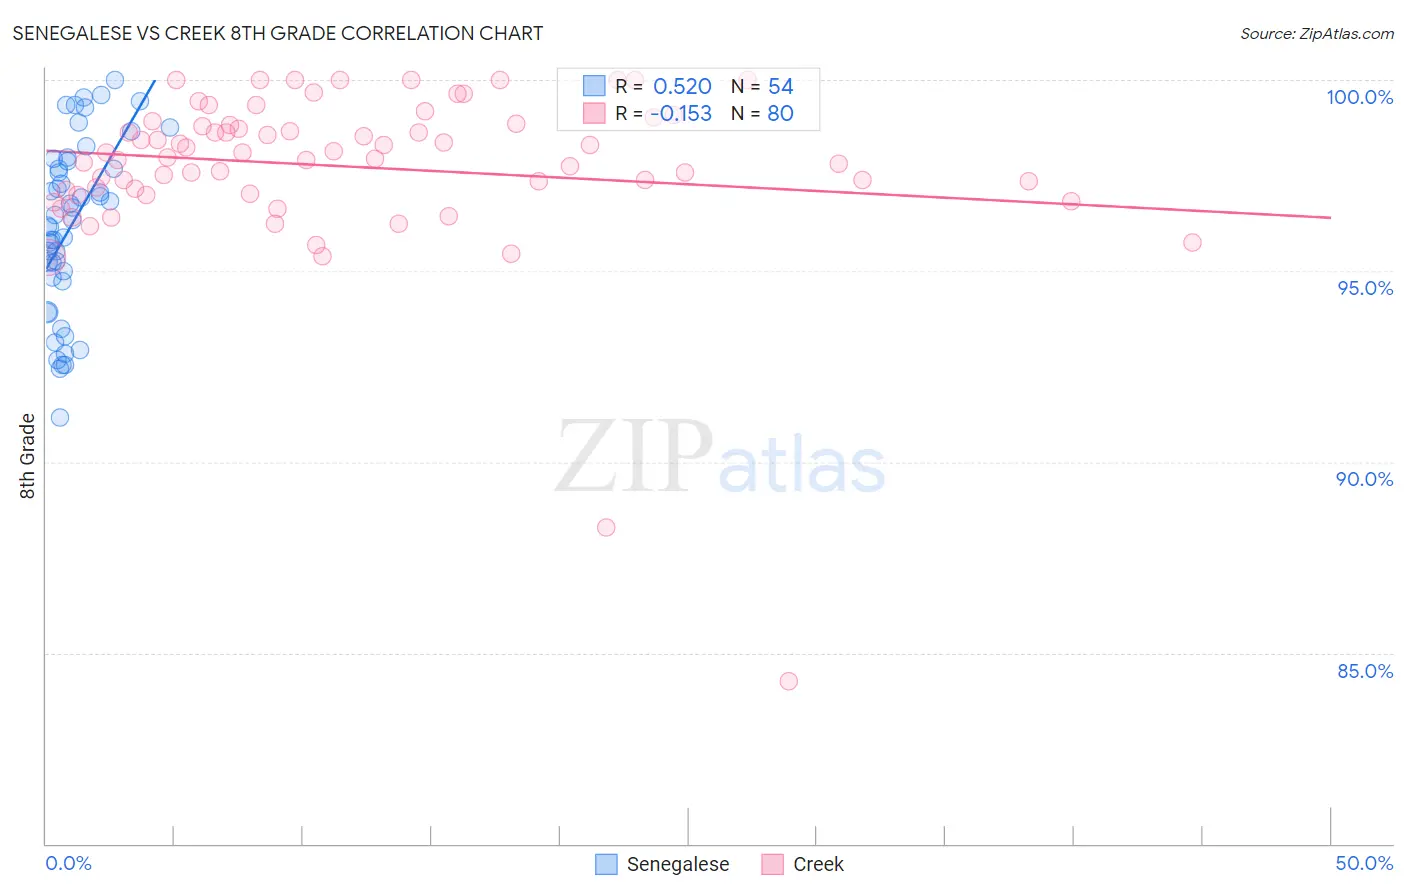
Senegalese vs Creek 8th Grade Correlation Chart
The statistical analysis conducted on geographies consisting of 78,142,569 people shows a substantial positive correlation between the proportion of Senegalese and percentage of population with at least 8th grade education in the United States with a correlation coefficient (R) of 0.520 and weighted average of 95.2%. Similarly, the statistical analysis conducted on geographies consisting of 178,480,629 people shows a poor negative correlation between the proportion of Creek and percentage of population with at least 8th grade education in the United States with a correlation coefficient (R) of -0.153 and weighted average of 96.6%, a difference of 1.5%.
8th Grade Correlation Summary
| Measurement | Senegalese | Creek |
| Minimum | 91.2% | 84.3% |
| Maximum | 100.0% | 100.0% |
| Range | 8.8% | 15.7% |
| Mean | 96.2% | 97.7% |
| Median | 96.4% | 98.0% |
| Interquartile 25% (IQ1) | 94.8% | 97.1% |
| Interquartile 75% (IQ3) | 97.9% | 98.8% |
| Interquartile Range (IQR) | 3.0% | 1.8% |
| Standard Deviation (Sample) | 2.3% | 2.3% |
| Standard Deviation (Population) | 2.2% | 2.2% |
Similar Demographics by 8th Grade
Demographics Similar to Senegalese by 8th Grade
In terms of 8th grade, the demographic groups most similar to Senegalese are Immigrants from Africa (95.2%, a difference of 0.0%), Nigerian (95.2%, a difference of 0.010%), Immigrants from Asia (95.2%, a difference of 0.020%), Costa Rican (95.2%, a difference of 0.020%), and Indian (Asian) (95.2%, a difference of 0.030%).
| Demographics | Rating | Rank | 8th Grade |
| Immigrants | Indonesia | 4.4 /100 | #229 | Tragic 95.3% |
| Immigrants | Panama | 4.1 /100 | #230 | Tragic 95.2% |
| Asians | 3.5 /100 | #231 | Tragic 95.2% |
| Indians (Asian) | 3.3 /100 | #232 | Tragic 95.2% |
| Immigrants | Asia | 3.1 /100 | #233 | Tragic 95.2% |
| Costa Ricans | 3.0 /100 | #234 | Tragic 95.2% |
| Nigerians | 2.9 /100 | #235 | Tragic 95.2% |
| Senegalese | 2.7 /100 | #236 | Tragic 95.2% |
| Immigrants | Africa | 2.7 /100 | #237 | Tragic 95.2% |
| Natives/Alaskans | 2.3 /100 | #238 | Tragic 95.2% |
| Immigrants | Sierra Leone | 2.1 /100 | #239 | Tragic 95.1% |
| Ethiopians | 2.0 /100 | #240 | Tragic 95.1% |
| South American Indians | 1.9 /100 | #241 | Tragic 95.1% |
| Tongans | 1.7 /100 | #242 | Tragic 95.1% |
| Paiute | 1.7 /100 | #243 | Tragic 95.1% |
Demographics Similar to Creek by 8th Grade
In terms of 8th grade, the demographic groups most similar to Creek are American (96.6%, a difference of 0.0%), Iranian (96.6%, a difference of 0.010%), Immigrants from India (96.6%, a difference of 0.020%), Native Hawaiian (96.6%, a difference of 0.020%), and Canadian (96.6%, a difference of 0.020%).
| Demographics | Rating | Rank | 8th Grade |
| Immigrants | Austria | 99.8 /100 | #61 | Exceptional 96.7% |
| Whites/Caucasians | 99.8 /100 | #62 | Exceptional 96.7% |
| Ukrainians | 99.7 /100 | #63 | Exceptional 96.7% |
| Immigrants | India | 99.7 /100 | #64 | Exceptional 96.6% |
| Native Hawaiians | 99.7 /100 | #65 | Exceptional 96.6% |
| Canadians | 99.7 /100 | #66 | Exceptional 96.6% |
| Iranians | 99.7 /100 | #67 | Exceptional 96.6% |
| Creek | 99.7 /100 | #68 | Exceptional 96.6% |
| Americans | 99.7 /100 | #69 | Exceptional 96.6% |
| Immigrants | Lithuania | 99.6 /100 | #70 | Exceptional 96.6% |
| New Zealanders | 99.5 /100 | #71 | Exceptional 96.6% |
| Immigrants | England | 99.5 /100 | #72 | Exceptional 96.6% |
| Arapaho | 99.5 /100 | #73 | Exceptional 96.6% |
| Immigrants | Ireland | 99.5 /100 | #74 | Exceptional 96.5% |
| Zimbabweans | 99.4 /100 | #75 | Exceptional 96.5% |