Seminole vs Sri Lankan In Labor Force | Age 30-34
COMPARE
Seminole
Sri Lankan
In Labor Force | Age 30-34
In Labor Force | Age 30-34 Comparison
Seminole
Sri Lankans
80.8%
IN LABOR FORCE | AGE 30-34
0.0/ 100
METRIC RATING
326th/ 347
METRIC RANK
85.0%
IN LABOR FORCE | AGE 30-34
87.8/ 100
METRIC RATING
138th/ 347
METRIC RANK
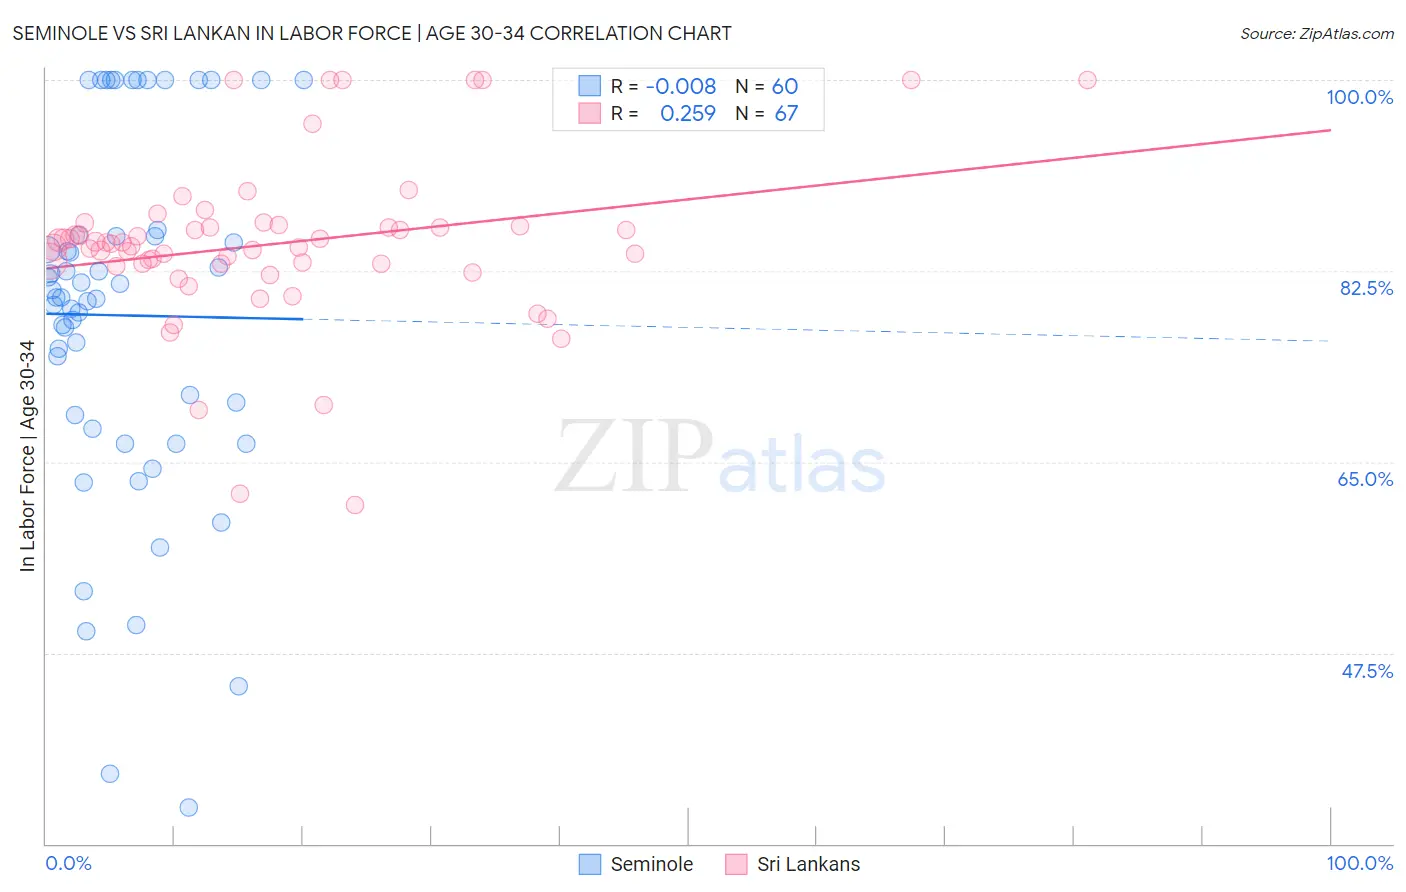
Seminole vs Sri Lankan In Labor Force | Age 30-34 Correlation Chart
The statistical analysis conducted on geographies consisting of 118,296,286 people shows no correlation between the proportion of Seminole and labor force participation rate among population between the ages 30 and 34 in the United States with a correlation coefficient (R) of -0.008 and weighted average of 80.8%. Similarly, the statistical analysis conducted on geographies consisting of 440,177,214 people shows a weak positive correlation between the proportion of Sri Lankans and labor force participation rate among population between the ages 30 and 34 in the United States with a correlation coefficient (R) of 0.259 and weighted average of 85.0%, a difference of 5.1%.
In Labor Force | Age 30-34 Correlation Summary
| Measurement | Seminole | Sri Lankan |
| Minimum | 33.3% | 61.0% |
| Maximum | 100.0% | 100.0% |
| Range | 66.7% | 39.0% |
| Mean | 78.4% | 85.0% |
| Median | 80.0% | 85.0% |
| Interquartile 25% (IQ1) | 68.6% | 83.2% |
| Interquartile 75% (IQ3) | 85.7% | 86.6% |
| Interquartile Range (IQR) | 17.1% | 3.4% |
| Standard Deviation (Sample) | 16.5% | 7.6% |
| Standard Deviation (Population) | 16.3% | 7.5% |
Similar Demographics by In Labor Force | Age 30-34
Demographics Similar to Seminole by In Labor Force | Age 30-34
In terms of in labor force | age 30-34, the demographic groups most similar to Seminole are Colville (80.7%, a difference of 0.19%), Dutch West Indian (81.0%, a difference of 0.22%), Cheyenne (81.1%, a difference of 0.38%), Paiute (81.2%, a difference of 0.41%), and Puerto Rican (81.2%, a difference of 0.46%).
| Demographics | Rating | Rank | In Labor Force | Age 30-34 |
| Shoshone | 0.0 /100 | #319 | Tragic 81.4% |
| Yaqui | 0.0 /100 | #320 | Tragic 81.4% |
| Alaska Natives | 0.0 /100 | #321 | Tragic 81.3% |
| Puerto Ricans | 0.0 /100 | #322 | Tragic 81.2% |
| Paiute | 0.0 /100 | #323 | Tragic 81.2% |
| Cheyenne | 0.0 /100 | #324 | Tragic 81.1% |
| Dutch West Indians | 0.0 /100 | #325 | Tragic 81.0% |
| Seminole | 0.0 /100 | #326 | Tragic 80.8% |
| Colville | 0.0 /100 | #327 | Tragic 80.7% |
| Sioux | 0.0 /100 | #328 | Tragic 80.4% |
| Creek | 0.0 /100 | #329 | Tragic 80.4% |
| Pueblo | 0.0 /100 | #330 | Tragic 80.0% |
| Houma | 0.0 /100 | #331 | Tragic 79.9% |
| Kiowa | 0.0 /100 | #332 | Tragic 79.8% |
| Inupiat | 0.0 /100 | #333 | Tragic 79.7% |
Demographics Similar to Sri Lankans by In Labor Force | Age 30-34
In terms of in labor force | age 30-34, the demographic groups most similar to Sri Lankans are South African (85.0%, a difference of 0.0%), Jordanian (85.0%, a difference of 0.010%), Bhutanese (85.0%, a difference of 0.010%), Immigrants from Chile (85.0%, a difference of 0.020%), and Immigrants from Asia (85.0%, a difference of 0.020%).
| Demographics | Rating | Rank | In Labor Force | Age 30-34 |
| Chinese | 89.6 /100 | #131 | Excellent 85.0% |
| Immigrants | Israel | 89.5 /100 | #132 | Excellent 85.0% |
| New Zealanders | 89.5 /100 | #133 | Excellent 85.0% |
| Immigrants | Chile | 89.2 /100 | #134 | Excellent 85.0% |
| Immigrants | Asia | 88.9 /100 | #135 | Excellent 85.0% |
| Jordanians | 88.6 /100 | #136 | Excellent 85.0% |
| South Africans | 88.0 /100 | #137 | Excellent 85.0% |
| Sri Lankans | 87.8 /100 | #138 | Excellent 85.0% |
| Bhutanese | 87.5 /100 | #139 | Excellent 85.0% |
| Immigrants | Vietnam | 86.5 /100 | #140 | Excellent 85.0% |
| Chileans | 85.3 /100 | #141 | Excellent 84.9% |
| Immigrants | Indonesia | 84.3 /100 | #142 | Excellent 84.9% |
| Colombians | 82.2 /100 | #143 | Excellent 84.9% |
| Uruguayans | 78.5 /100 | #144 | Good 84.9% |
| Palestinians | 77.7 /100 | #145 | Good 84.9% |