Seminole vs Sri Lankan No Vehicles in Household
COMPARE
Seminole
Sri Lankan
No Vehicles in Household
No Vehicles in Household Comparison
Seminole
Sri Lankans
9.0%
NO VEHICLES IN HOUSEHOLD
98.3/ 100
METRIC RATING
103rd/ 347
METRIC RANK
7.6%
NO VEHICLES IN HOUSEHOLD
100.0/ 100
METRIC RATING
26th/ 347
METRIC RANK
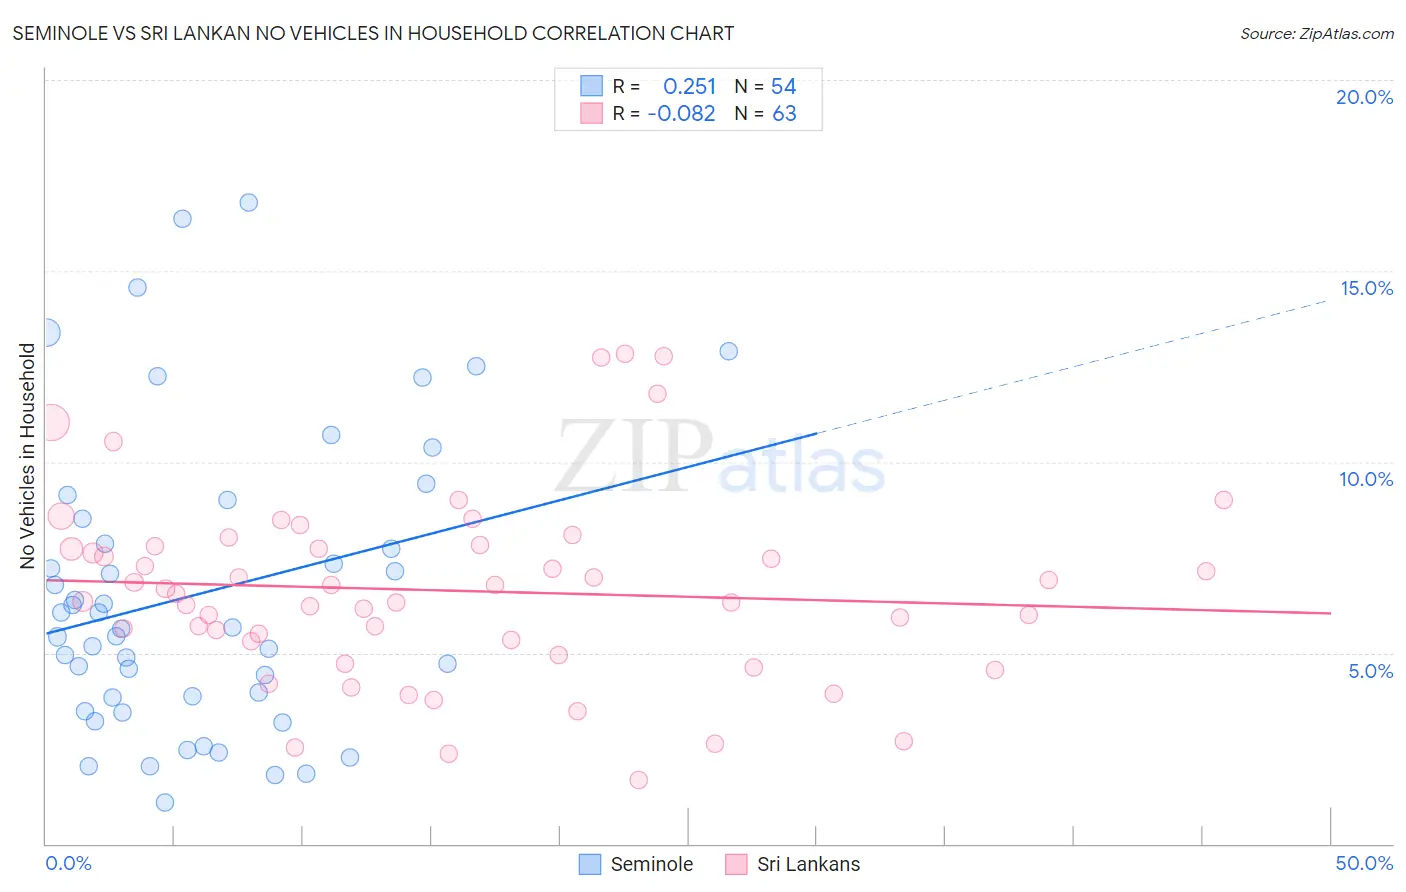
Seminole vs Sri Lankan No Vehicles in Household Correlation Chart
The statistical analysis conducted on geographies consisting of 118,219,598 people shows a weak positive correlation between the proportion of Seminole and percentage of households with no vehicle available in the United States with a correlation coefficient (R) of 0.251 and weighted average of 9.0%. Similarly, the statistical analysis conducted on geographies consisting of 439,098,815 people shows a slight negative correlation between the proportion of Sri Lankans and percentage of households with no vehicle available in the United States with a correlation coefficient (R) of -0.082 and weighted average of 7.6%, a difference of 18.4%.
No Vehicles in Household Correlation Summary
| Measurement | Seminole | Sri Lankan |
| Minimum | 1.1% | 1.7% |
| Maximum | 16.8% | 12.8% |
| Range | 15.7% | 11.2% |
| Mean | 6.6% | 6.6% |
| Median | 5.7% | 6.5% |
| Interquartile 25% (IQ1) | 3.8% | 5.3% |
| Interquartile 75% (IQ3) | 8.5% | 7.8% |
| Interquartile Range (IQR) | 4.7% | 2.5% |
| Standard Deviation (Sample) | 3.9% | 2.5% |
| Standard Deviation (Population) | 3.8% | 2.4% |
Similar Demographics by No Vehicles in Household
Demographics Similar to Seminole by No Vehicles in Household
In terms of no vehicles in household, the demographic groups most similar to Seminole are Yugoslavian (9.0%, a difference of 0.0%), Pakistani (9.0%, a difference of 0.050%), Asian (9.0%, a difference of 0.080%), Bulgarian (9.0%, a difference of 0.27%), and Slavic (9.0%, a difference of 0.32%).
| Demographics | Rating | Rank | No Vehicles in Household |
| Immigrants | Bolivia | 98.7 /100 | #96 | Exceptional 8.9% |
| Immigrants | Central America | 98.5 /100 | #97 | Exceptional 8.9% |
| Slavs | 98.4 /100 | #98 | Exceptional 9.0% |
| Bulgarians | 98.4 /100 | #99 | Exceptional 9.0% |
| Asians | 98.3 /100 | #100 | Exceptional 9.0% |
| Pakistanis | 98.3 /100 | #101 | Exceptional 9.0% |
| Yugoslavians | 98.3 /100 | #102 | Exceptional 9.0% |
| Seminole | 98.3 /100 | #103 | Exceptional 9.0% |
| Zimbabweans | 98.0 /100 | #104 | Exceptional 9.0% |
| Spanish Americans | 97.9 /100 | #105 | Exceptional 9.1% |
| Laotians | 97.8 /100 | #106 | Exceptional 9.1% |
| Hispanics or Latinos | 97.7 /100 | #107 | Exceptional 9.1% |
| Mexican American Indians | 97.6 /100 | #108 | Exceptional 9.1% |
| Maltese | 97.6 /100 | #109 | Exceptional 9.1% |
| Delaware | 97.2 /100 | #110 | Exceptional 9.2% |
Demographics Similar to Sri Lankans by No Vehicles in Household
In terms of no vehicles in household, the demographic groups most similar to Sri Lankans are British (7.6%, a difference of 0.050%), Samoan (7.6%, a difference of 0.60%), American (7.7%, a difference of 0.89%), Finnish (7.7%, a difference of 1.2%), and Native Hawaiian (7.7%, a difference of 1.3%).
| Demographics | Rating | Rank | No Vehicles in Household |
| Arapaho | 100.0 /100 | #19 | Exceptional 7.4% |
| Ottawa | 100.0 /100 | #20 | Exceptional 7.4% |
| Nepalese | 100.0 /100 | #21 | Exceptional 7.4% |
| Irish | 100.0 /100 | #22 | Exceptional 7.4% |
| French | 100.0 /100 | #23 | Exceptional 7.4% |
| Immigrants | Iraq | 100.0 /100 | #24 | Exceptional 7.5% |
| Yaqui | 100.0 /100 | #25 | Exceptional 7.5% |
| Sri Lankans | 100.0 /100 | #26 | Exceptional 7.6% |
| British | 100.0 /100 | #27 | Exceptional 7.6% |
| Samoans | 100.0 /100 | #28 | Exceptional 7.6% |
| Americans | 100.0 /100 | #29 | Exceptional 7.7% |
| Finns | 100.0 /100 | #30 | Exceptional 7.7% |
| Native Hawaiians | 100.0 /100 | #31 | Exceptional 7.7% |
| Malaysians | 100.0 /100 | #32 | Exceptional 7.7% |
| Immigrants | Taiwan | 100.0 /100 | #33 | Exceptional 7.7% |