Immigrants from Albania vs Indonesian Married-couple Households
COMPARE
Immigrants from Albania
Indonesian
Married-couple Households
Married-couple Households Comparison
Immigrants from Albania
Indonesians
44.4%
MARRIED-COUPLE HOUSEHOLDS
1.0/ 100
METRIC RATING
242nd/ 347
METRIC RANK
42.0%
MARRIED-COUPLE HOUSEHOLDS
0.0/ 100
METRIC RATING
292nd/ 347
METRIC RANK
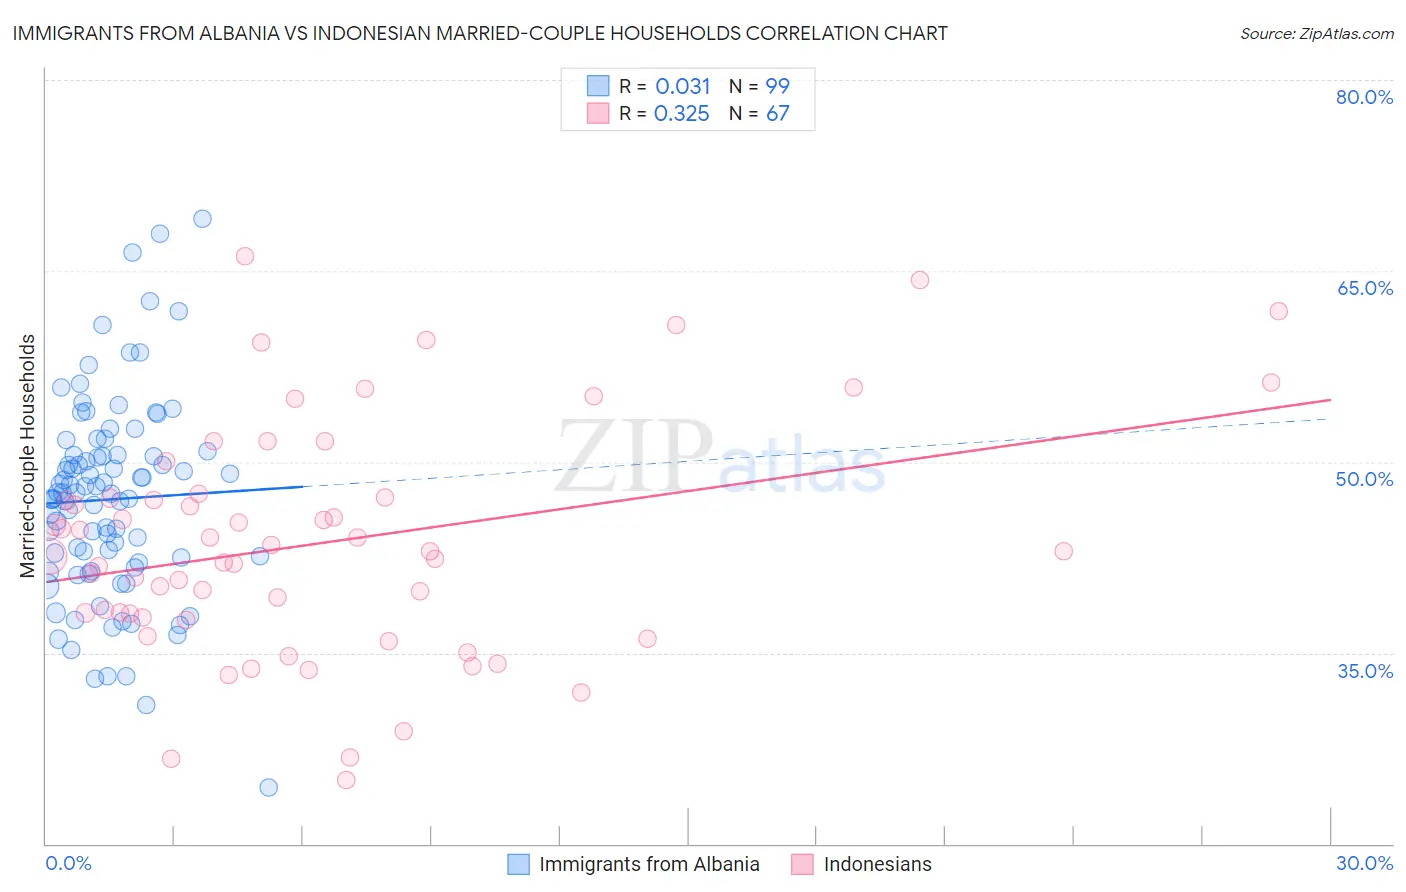
Immigrants from Albania vs Indonesian Married-couple Households Correlation Chart
The statistical analysis conducted on geographies consisting of 119,383,494 people shows no correlation between the proportion of Immigrants from Albania and percentage of married-couple family households in the United States with a correlation coefficient (R) of 0.031 and weighted average of 44.4%. Similarly, the statistical analysis conducted on geographies consisting of 162,636,634 people shows a mild positive correlation between the proportion of Indonesians and percentage of married-couple family households in the United States with a correlation coefficient (R) of 0.325 and weighted average of 42.0%, a difference of 5.7%.
Married-couple Households Correlation Summary
| Measurement | Immigrants from Albania | Indonesian |
| Minimum | 24.4% | 25.1% |
| Maximum | 69.1% | 66.1% |
| Range | 44.7% | 41.1% |
| Mean | 47.0% | 43.7% |
| Median | 47.6% | 43.0% |
| Interquartile 25% (IQ1) | 42.1% | 37.8% |
| Interquartile 75% (IQ3) | 50.5% | 47.2% |
| Interquartile Range (IQR) | 8.4% | 9.4% |
| Standard Deviation (Sample) | 7.9% | 9.1% |
| Standard Deviation (Population) | 7.8% | 9.0% |
Similar Demographics by Married-couple Households
Demographics Similar to Immigrants from Albania by Married-couple Households
In terms of married-couple households, the demographic groups most similar to Immigrants from Albania are Ute (44.4%, a difference of 0.040%), Immigrants from Bosnia and Herzegovina (44.4%, a difference of 0.040%), Immigrants from Saudi Arabia (44.4%, a difference of 0.070%), Spanish American (44.5%, a difference of 0.12%), and Immigrants from Uruguay (44.5%, a difference of 0.14%).
| Demographics | Rating | Rank | Married-couple Households |
| Immigrants | Nicaragua | 1.2 /100 | #235 | Tragic 44.5% |
| Yaqui | 1.2 /100 | #236 | Tragic 44.5% |
| Comanche | 1.2 /100 | #237 | Tragic 44.5% |
| Immigrants | Uruguay | 1.1 /100 | #238 | Tragic 44.5% |
| Spanish Americans | 1.1 /100 | #239 | Tragic 44.5% |
| Ute | 1.0 /100 | #240 | Tragic 44.4% |
| Immigrants | Bosnia and Herzegovina | 1.0 /100 | #241 | Tragic 44.4% |
| Immigrants | Albania | 1.0 /100 | #242 | Tragic 44.4% |
| Immigrants | Saudi Arabia | 0.9 /100 | #243 | Tragic 44.4% |
| Immigrants | Armenia | 0.7 /100 | #244 | Tragic 44.3% |
| Immigrants | El Salvador | 0.7 /100 | #245 | Tragic 44.3% |
| Immigrants | Cuba | 0.6 /100 | #246 | Tragic 44.2% |
| Immigrants | Morocco | 0.6 /100 | #247 | Tragic 44.2% |
| Yup'ik | 0.4 /100 | #248 | Tragic 44.1% |
| Immigrants | Kenya | 0.4 /100 | #249 | Tragic 44.1% |
Demographics Similar to Indonesians by Married-couple Households
In terms of married-couple households, the demographic groups most similar to Indonesians are Paiute (42.1%, a difference of 0.050%), Honduran (42.1%, a difference of 0.060%), Sudanese (42.1%, a difference of 0.11%), Menominee (42.0%, a difference of 0.11%), and Immigrants from Yemen (42.0%, a difference of 0.12%).
| Demographics | Rating | Rank | Married-couple Households |
| Ghanaians | 0.0 /100 | #285 | Tragic 42.2% |
| Belizeans | 0.0 /100 | #286 | Tragic 42.2% |
| Chippewa | 0.0 /100 | #287 | Tragic 42.1% |
| Immigrants | Eritrea | 0.0 /100 | #288 | Tragic 42.1% |
| Sudanese | 0.0 /100 | #289 | Tragic 42.1% |
| Hondurans | 0.0 /100 | #290 | Tragic 42.1% |
| Paiute | 0.0 /100 | #291 | Tragic 42.1% |
| Indonesians | 0.0 /100 | #292 | Tragic 42.0% |
| Menominee | 0.0 /100 | #293 | Tragic 42.0% |
| Immigrants | Yemen | 0.0 /100 | #294 | Tragic 42.0% |
| Kiowa | 0.0 /100 | #295 | Tragic 42.0% |
| Immigrants | Sudan | 0.0 /100 | #296 | Tragic 41.9% |
| Arapaho | 0.0 /100 | #297 | Tragic 41.8% |
| Immigrants | Middle Africa | 0.0 /100 | #298 | Tragic 41.8% |
| Immigrants | Ghana | 0.0 /100 | #299 | Tragic 41.8% |