Welsh vs Indonesian Married-couple Households
COMPARE
Welsh
Indonesian
Married-couple Households
Married-couple Households Comparison
Welsh
Indonesians
48.8%
MARRIED-COUPLE HOUSEHOLDS
99.5/ 100
METRIC RATING
44th/ 347
METRIC RANK
42.0%
MARRIED-COUPLE HOUSEHOLDS
0.0/ 100
METRIC RATING
292nd/ 347
METRIC RANK
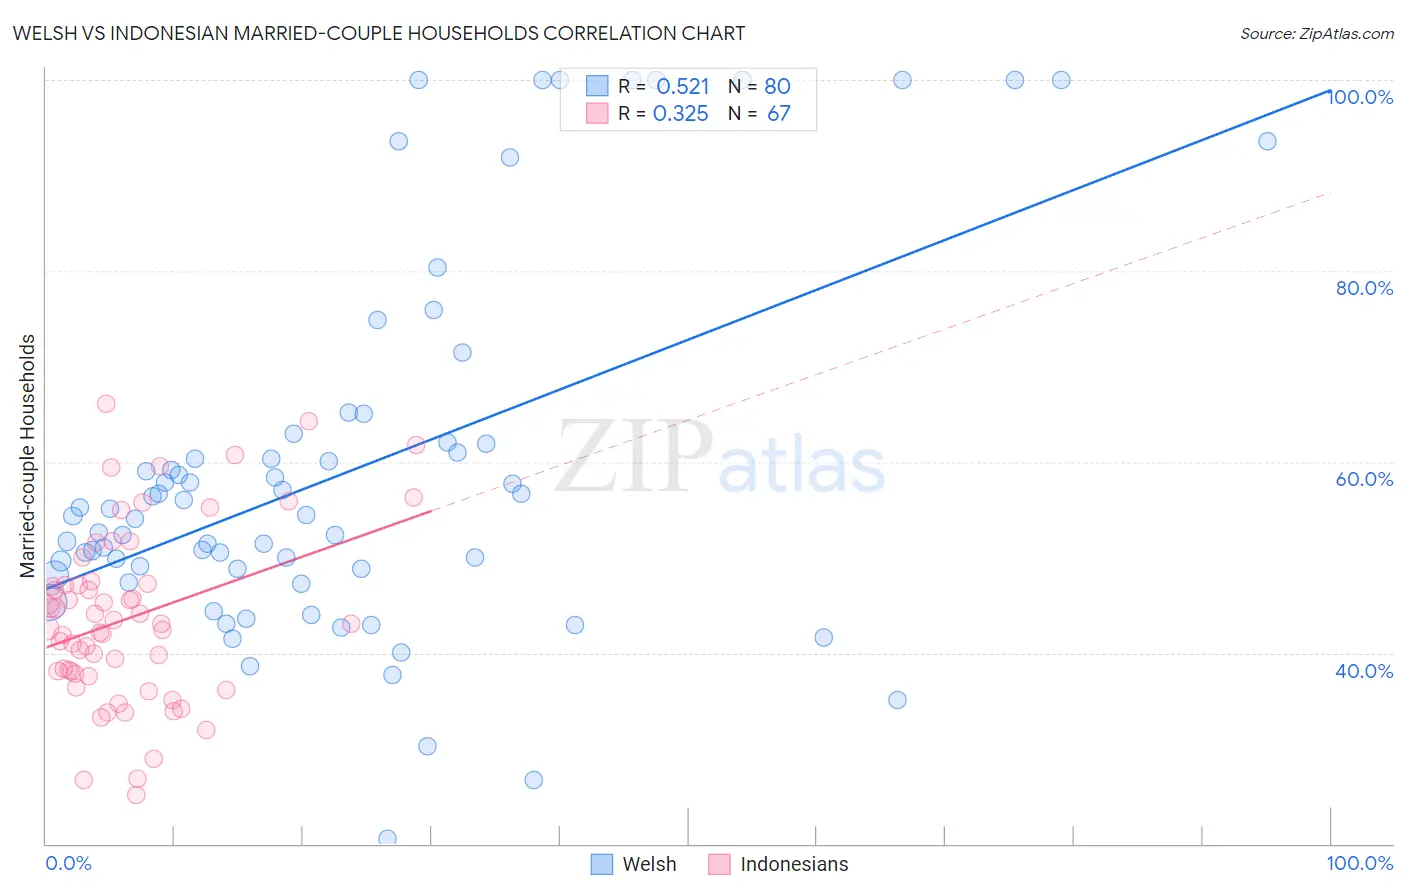
Welsh vs Indonesian Married-couple Households Correlation Chart
The statistical analysis conducted on geographies consisting of 528,152,714 people shows a substantial positive correlation between the proportion of Welsh and percentage of married-couple family households in the United States with a correlation coefficient (R) of 0.521 and weighted average of 48.8%. Similarly, the statistical analysis conducted on geographies consisting of 162,636,634 people shows a mild positive correlation between the proportion of Indonesians and percentage of married-couple family households in the United States with a correlation coefficient (R) of 0.325 and weighted average of 42.0%, a difference of 16.1%.
Married-couple Households Correlation Summary
| Measurement | Welsh | Indonesian |
| Minimum | 20.5% | 25.1% |
| Maximum | 100.0% | 66.1% |
| Range | 79.5% | 41.1% |
| Mean | 59.0% | 43.7% |
| Median | 54.3% | 43.0% |
| Interquartile 25% (IQ1) | 48.5% | 37.8% |
| Interquartile 75% (IQ3) | 62.0% | 47.2% |
| Interquartile Range (IQR) | 13.5% | 9.4% |
| Standard Deviation (Sample) | 19.3% | 9.1% |
| Standard Deviation (Population) | 19.2% | 9.0% |
Similar Demographics by Married-couple Households
Demographics Similar to Welsh by Married-couple Households
In terms of married-couple households, the demographic groups most similar to Welsh are Immigrants from Eastern Asia (48.8%, a difference of 0.030%), Immigrants from Iran (48.8%, a difference of 0.050%), Tsimshian (48.7%, a difference of 0.080%), Immigrants from Vietnam (48.8%, a difference of 0.10%), and British (48.7%, a difference of 0.10%).
| Demographics | Rating | Rank | Married-couple Households |
| Sri Lankans | 99.7 /100 | #37 | Exceptional 49.0% |
| Greeks | 99.7 /100 | #38 | Exceptional 48.9% |
| Lithuanians | 99.6 /100 | #39 | Exceptional 48.9% |
| Immigrants | Bolivia | 99.6 /100 | #40 | Exceptional 48.9% |
| Immigrants | Lebanon | 99.6 /100 | #41 | Exceptional 48.9% |
| Immigrants | Vietnam | 99.6 /100 | #42 | Exceptional 48.8% |
| Immigrants | Iran | 99.6 /100 | #43 | Exceptional 48.8% |
| Welsh | 99.5 /100 | #44 | Exceptional 48.8% |
| Immigrants | Eastern Asia | 99.5 /100 | #45 | Exceptional 48.8% |
| Tsimshian | 99.5 /100 | #46 | Exceptional 48.7% |
| British | 99.5 /100 | #47 | Exceptional 48.7% |
| Indians (Asian) | 99.4 /100 | #48 | Exceptional 48.7% |
| Immigrants | Sri Lanka | 99.4 /100 | #49 | Exceptional 48.7% |
| Samoans | 99.4 /100 | #50 | Exceptional 48.7% |
| Eastern Europeans | 99.3 /100 | #51 | Exceptional 48.6% |
Demographics Similar to Indonesians by Married-couple Households
In terms of married-couple households, the demographic groups most similar to Indonesians are Paiute (42.1%, a difference of 0.050%), Honduran (42.1%, a difference of 0.060%), Sudanese (42.1%, a difference of 0.11%), Menominee (42.0%, a difference of 0.11%), and Immigrants from Yemen (42.0%, a difference of 0.12%).
| Demographics | Rating | Rank | Married-couple Households |
| Ghanaians | 0.0 /100 | #285 | Tragic 42.2% |
| Belizeans | 0.0 /100 | #286 | Tragic 42.2% |
| Chippewa | 0.0 /100 | #287 | Tragic 42.1% |
| Immigrants | Eritrea | 0.0 /100 | #288 | Tragic 42.1% |
| Sudanese | 0.0 /100 | #289 | Tragic 42.1% |
| Hondurans | 0.0 /100 | #290 | Tragic 42.1% |
| Paiute | 0.0 /100 | #291 | Tragic 42.1% |
| Indonesians | 0.0 /100 | #292 | Tragic 42.0% |
| Menominee | 0.0 /100 | #293 | Tragic 42.0% |
| Immigrants | Yemen | 0.0 /100 | #294 | Tragic 42.0% |
| Kiowa | 0.0 /100 | #295 | Tragic 42.0% |
| Immigrants | Sudan | 0.0 /100 | #296 | Tragic 41.9% |
| Arapaho | 0.0 /100 | #297 | Tragic 41.8% |
| Immigrants | Middle Africa | 0.0 /100 | #298 | Tragic 41.8% |
| Immigrants | Ghana | 0.0 /100 | #299 | Tragic 41.8% |