Scottish vs South African Currently Married

COMPARE

Scottish
Race
Ancestry
AfghanAfricanAlaska NativeAlaskan AthabascanAlbanianAleutAlsatianAmericanApacheArabArapahoArgentineanArmenianAssyrian/Chaldean/SyriacAustralianAustrianBahamianBangladeshiBarbadianBasqueBelgianBelizeanBermudanBhutaneseBlackfeetBolivianBrazilianBritishBritish West IndianBulgarianBurmeseCajunCambodianCanadianCape VerdeanCarpatho RusynCelticCentral AmericanCentral American IndianCherokeeCheyenneChickasawChileanChineseChippewaChoctawColombianColvilleComancheCosta RicanCreeCreekCroatianCrowCubanCypriotCzechCzechoslovakianDanishDelawareDominicanDutchDutch West IndianEastern EuropeanEcuadorianEgyptianEnglishEstonianEthiopianEuropeanFijianFilipinoFinnishFrenchFrench American IndianFrench CanadianGermanGerman RussianGhanaianGreekGuamanian/ChamorroGuatemalanGuyaneseHaitianHmongHonduranHopiHoumaHungarianIcelanderIndian (Asian)IndonesianInupiatIranianIraqiIrishIroquoisIsraeliItalianJamaicanJapaneseJordanianKenyanKiowaKoreanLaotianLatvianLebaneseLiberianLithuanianLumbeeLuxembourgerMacedonianMalaysianMalteseMarshalleseMenomineeMexicanMexican American IndianMongolianMoroccanNative HawaiianNavajoNepaleseNew ZealanderNicaraguanNigerianNorthern EuropeanNorwegianOkinawanOsageOttawaPaiutePakistaniPalestinianPanamanianParaguayanPennsylvania GermanPeruvianPimaPolishPortuguesePotawatomiPuebloPuerto RicanPuget Sound SalishRomanianRussianSalvadoranSamoanScandinavianScotch-IrishScottishSeminoleSenegaleseSerbianShoshoneSierra LeoneanSiouxSlavicSlovakSloveneSomaliSouth AmericanSouth American IndianSoviet UnionSpaniardSpanishSpanish AmericanSpanish American IndianSri LankanSubsaharan AfricanSudaneseSwedishSwissSyrianTaiwaneseThaiTlingit-HaidaTohono O'OdhamTonganTrinidadian and TobagonianTsimshianTurkishU.S. Virgin IslanderUgandanUkrainianUruguayanUteVenezuelanVietnameseWelshWest IndianYakamaYaquiYugoslavianYumanYup'ikZimbabwean
Immigration
NonimmigrantsImmigrantsAfghanistanAfricaAlbaniaArgentinaArmeniaAsiaAustraliaAustriaBahamasBangladeshBarbadosBelarusBelgiumBelizeBoliviaBosnia and HerzegovinaBrazilBulgariaBurma/MyanmarCabo VerdeCambodiaCameroonCanadaCaribbeanCentral AmericaChileChinaColombiaCongoCosta RicaCroatiaCubaCzechoslovakiaDenmarkDominicaDominican RepublicEastern AfricaEastern AsiaEastern EuropeEcuadorEgyptEl SalvadorEnglandEritreaEthiopiaEuropeFijiFranceGermanyGhanaGreeceGrenadaGuatemalaGuyanaHaitiHondurasHong KongHungaryIndiaIndonesiaIranIraqIrelandIsraelItalyJamaicaJapanJordanKazakhstanKenyaKoreaKuwaitLaosLatin AmericaLatviaLebanonLiberiaLithuaniaMalaysiaMexicoMicronesiaMiddle AfricaMoldovaMoroccoNepalNetherlandsNicaraguaNigeriaNorth AmericaNorth MacedoniaNorthern AfricaNorthern EuropeNorwayOceaniaPakistanPanamaPeruPhilippinesPolandPortugalRomaniaRussiaSaudi ArabiaScotlandSenegalSerbiaSierra LeoneSingaporeSomaliaSouth AfricaSouth AmericaSouth Central AsiaSouth Eastern AsiaSouthern EuropeSpainSri LankaSt. Vincent and the GrenadinesSudanSwedenSwitzerlandSyriaTaiwanThailandTrinidad and TobagoTurkeyUgandaUkraineUruguayUzbekistanVenezuelaVietnamWest IndiesWestern AfricaWestern AsiaWestern EuropeYemenZaireZimbabweAzores
South African
Race
Ancestry
AfghanAfricanAlaska NativeAlaskan AthabascanAlbanianAleutAlsatianAmericanApacheArabArapahoArgentineanArmenianAssyrian/Chaldean/SyriacAustralianAustrianBahamianBangladeshiBarbadianBasqueBelgianBelizeanBermudanBhutaneseBlackfeetBolivianBrazilianBritishBritish West IndianBulgarianBurmeseCajunCambodianCanadianCape VerdeanCarpatho RusynCelticCentral AmericanCentral American IndianCherokeeCheyenneChickasawChileanChineseChippewaChoctawColombianColvilleComancheCosta RicanCreeCreekCroatianCrowCubanCypriotCzechCzechoslovakianDanishDelawareDominicanDutchDutch West IndianEastern EuropeanEcuadorianEgyptianEnglishEstonianEthiopianEuropeanFijianFilipinoFinnishFrenchFrench American IndianFrench CanadianGermanGerman RussianGhanaianGreekGuamanian/ChamorroGuatemalanGuyaneseHaitianHmongHonduranHopiHoumaHungarianIcelanderIndian (Asian)IndonesianInupiatIranianIraqiIrishIroquoisIsraeliItalianJamaicanJapaneseJordanianKenyanKiowaKoreanLaotianLatvianLebaneseLiberianLithuanianLumbeeLuxembourgerMacedonianMalaysianMalteseMarshalleseMenomineeMexicanMexican American IndianMongolianMoroccanNative HawaiianNavajoNepaleseNew ZealanderNicaraguanNigerianNorthern EuropeanNorwegianOkinawanOsageOttawaPaiutePakistaniPalestinianPanamanianParaguayanPennsylvania GermanPeruvianPimaPolishPortuguesePotawatomiPuebloPuerto RicanPuget Sound SalishRomanianRussianSalvadoranSamoanScandinavianScotch-IrishSeminoleSenegaleseSerbianShoshoneSierra LeoneanSiouxSlavicSlovakSloveneSomaliSouth AfricanSouth AmericanSouth American IndianSoviet UnionSpaniardSpanishSpanish AmericanSpanish American IndianSri LankanSubsaharan AfricanSudaneseSwedishSwissSyrianTaiwaneseThaiTlingit-HaidaTohono O'OdhamTonganTrinidadian and TobagonianTsimshianTurkishU.S. Virgin IslanderUgandanUkrainianUruguayanUteVenezuelanVietnameseWelshWest IndianYakamaYaquiYugoslavianYumanYup'ikZimbabwean
Immigration
NonimmigrantsImmigrantsAfghanistanAfricaAlbaniaArgentinaArmeniaAsiaAustraliaAustriaBahamasBangladeshBarbadosBelarusBelgiumBelizeBoliviaBosnia and HerzegovinaBrazilBulgariaBurma/MyanmarCabo VerdeCambodiaCameroonCanadaCaribbeanCentral AmericaChileChinaColombiaCongoCosta RicaCroatiaCubaCzechoslovakiaDenmarkDominicaDominican RepublicEastern AfricaEastern AsiaEastern EuropeEcuadorEgyptEl SalvadorEnglandEritreaEthiopiaEuropeFijiFranceGermanyGhanaGreeceGrenadaGuatemalaGuyanaHaitiHondurasHong KongHungaryIndiaIndonesiaIranIraqIrelandIsraelItalyJamaicaJapanJordanKazakhstanKenyaKoreaKuwaitLaosLatin AmericaLatviaLebanonLiberiaLithuaniaMalaysiaMexicoMicronesiaMiddle AfricaMoldovaMoroccoNepalNetherlandsNicaraguaNigeriaNorth AmericaNorth MacedoniaNorthern AfricaNorthern EuropeNorwayOceaniaPakistanPanamaPeruPhilippinesPolandPortugalRomaniaRussiaSaudi ArabiaScotlandSenegalSerbiaSierra LeoneSingaporeSomaliaSouth AfricaSouth AmericaSouth Central AsiaSouth Eastern AsiaSouthern EuropeSpainSri LankaSt. Vincent and the GrenadinesSudanSwedenSwitzerlandSyriaTaiwanThailandTrinidad and TobagoTurkeyUgandaUkraineUruguayUzbekistanVenezuelaVietnamWest IndiesWestern AfricaWestern AsiaWestern EuropeYemenZaireZimbabweAzores
Currently Married
Income
Poverty
Unemployment
Labor Participation
Family Structure
Vehicle Availability
Education Level
Disability

Currently Married Comparison

Scottish

South Africans

Exceptional
Exceptional
49.2%
CURRENTLY MARRIED
99.8/ 100
METRIC RATING
21st/ 347
METRIC RANK
47.6%
CURRENTLY MARRIED
90.5/ 100
METRIC RATING
114th/ 347
METRIC RANK

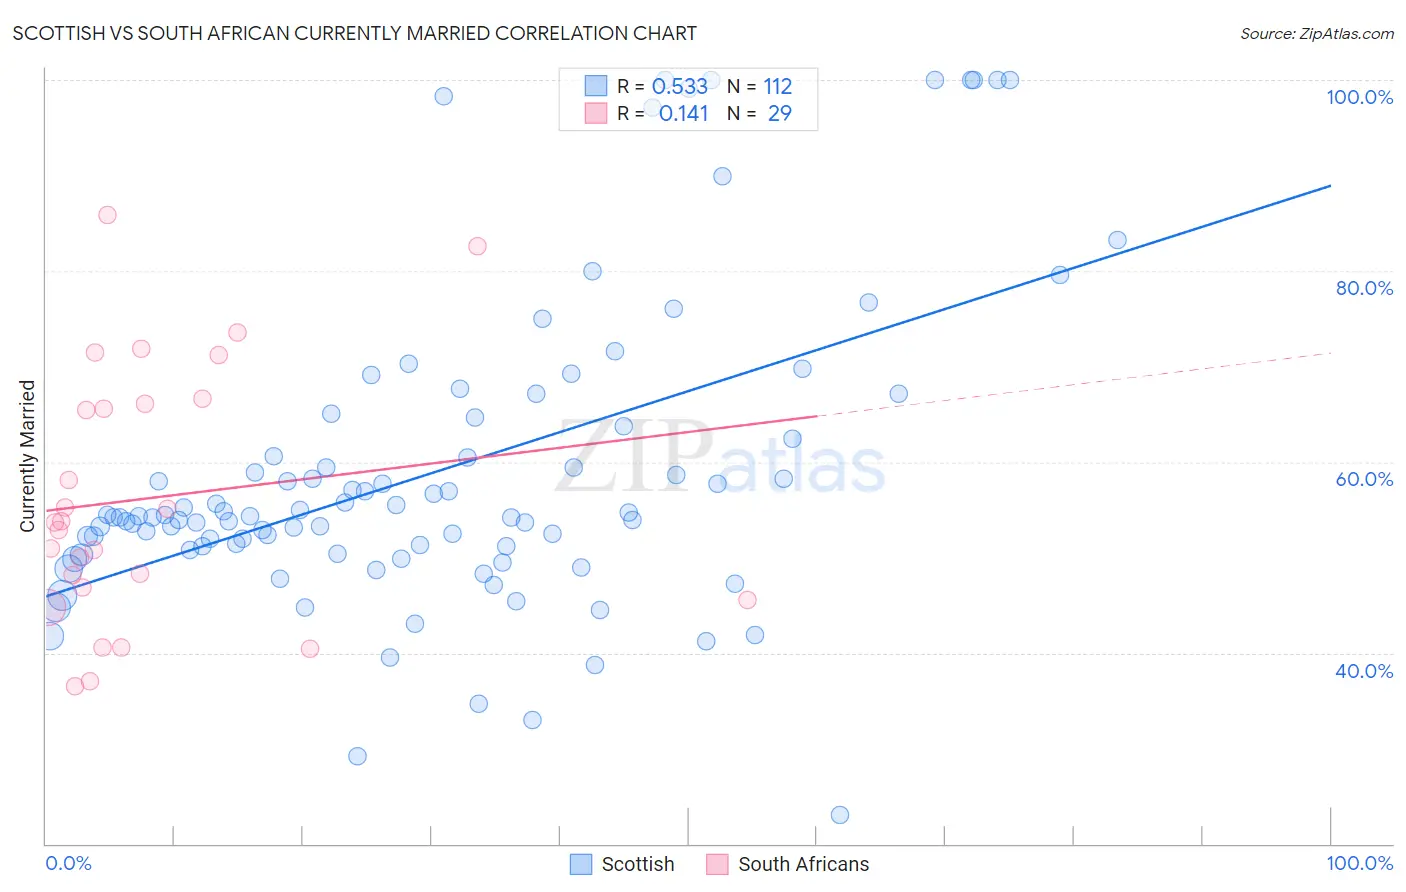
Scottish vs South African Currently Married Correlation Chart

The statistical analysis conducted on geographies consisting of 567,020,693 people shows a substantial positive correlation between the proportion of Scottish and percentage of population currently married in the United States with a correlation coefficient (R) of 0.533 and weighted average of 49.2%. Similarly, the statistical analysis conducted on geographies consisting of 182,588,333 people shows a poor positive correlation between the proportion of South Africans and percentage of population currently married in the United States with a correlation coefficient (R) of 0.141 and weighted average of 47.6%, a difference of 3.4%.
Scottish vs South African Currently Married

Currently Married Correlation Summary

MeasurementScottishSouth African
Minimum23.0%36.5%
Maximum100.0%85.8%
Range77.0%49.3%
Mean59.0%56.2%
Median54.2%53.7%
Interquartile 25% (IQ1)51.0%46.2%
Interquartile 75% (IQ3)63.0%66.3%
Interquartile Range (IQR)12.1%20.1%
Standard Deviation (Sample)16.3%13.4%
Standard Deviation (Population)16.2%13.2%

Similar Demographics by Currently Married

Demographics Similar to Scottish by Currently Married

In terms of currently married, the demographic groups most similar to Scottish are Luxembourger (49.3%, a difference of 0.11%), Bulgarian (49.1%, a difference of 0.22%), European (49.3%, a difference of 0.24%), Immigrants from Scotland (49.3%, a difference of 0.26%), and Immigrants from Pakistan (49.1%, a difference of 0.33%).
DemographicsRating | RankCurrently Married
Germans
99.9
/100
|
#14
Exceptional
49.6%
Pennsylvania Germans
99.9
/100
|
#15
Exceptional
49.6%
Chinese
99.9
/100
|
#16
Exceptional
49.5%
Scandinavians
99.9
/100
|
#17
Exceptional
49.5%
Immigrants | Scotland
99.8
/100
|
#18
Exceptional
49.3%
Europeans
99.8
/100
|
#19
Exceptional
49.3%
Luxembourgers
99.8
/100
|
#20
Exceptional
49.3%
Scottish
99.8
/100
|
#21
Exceptional
49.2%
Bulgarians
99.7
/100
|
#22
Exceptional
49.1%
Immigrants | Pakistan
99.7
/100
|
#23
Exceptional
49.1%
Lithuanians
99.6
/100
|
#24
Exceptional
49.0%
Maltese
99.6
/100
|
#25
Exceptional
49.0%
Immigrants | Korea
99.6
/100
|
#26
Exceptional
49.0%
Burmese
99.6
/100
|
#27
Exceptional
48.9%
Welsh
99.5
/100
|
#28
Exceptional
48.9%

Demographics Similar to South Africans by Currently Married

In terms of currently married, the demographic groups most similar to South Africans are Immigrants from Indonesia (47.6%, a difference of 0.0%), Palestinian (47.6%, a difference of 0.010%), Immigrants from Denmark (47.6%, a difference of 0.030%), Puget Sound Salish (47.6%, a difference of 0.030%), and Immigrants from Philippines (47.6%, a difference of 0.030%).
DemographicsRating | RankCurrently Married
Immigrants | Italy
92.9
/100
|
#107
Exceptional
47.7%
Tsimshian
92.4
/100
|
#108
Exceptional
47.7%
Immigrants | Egypt
92.3
/100
|
#109
Exceptional
47.7%
Immigrants | Russia
92.0
/100
|
#110
Exceptional
47.7%
Immigrants | Hungary
91.2
/100
|
#111
Exceptional
47.6%
Immigrants | Western Europe
91.1
/100
|
#112
Exceptional
47.6%
Immigrants | Denmark
90.9
/100
|
#113
Exceptional
47.6%
South Africans
90.5
/100
|
#114
Exceptional
47.6%
Immigrants | Indonesia
90.5
/100
|
#115
Exceptional
47.6%
Palestinians
90.4
/100
|
#116
Exceptional
47.6%
Puget Sound Salish
90.3
/100
|
#117
Exceptional
47.6%
Immigrants | Philippines
90.2
/100
|
#118
Exceptional
47.6%
Australians
90.2
/100
|
#119
Exceptional
47.6%
Syrians
88.9
/100
|
#120
Excellent
47.5%
Immigrants | Croatia
88.6
/100
|
#121
Excellent
47.5%