Scottish vs Sierra Leonean 10th Grade
COMPARE
Scottish
Sierra Leonean
10th Grade
10th Grade Comparison
Scottish
Sierra Leoneans
95.6%
10TH GRADE
100.0/ 100
METRIC RATING
16th/ 347
METRIC RANK
93.7%
10TH GRADE
46.1/ 100
METRIC RATING
178th/ 347
METRIC RANK
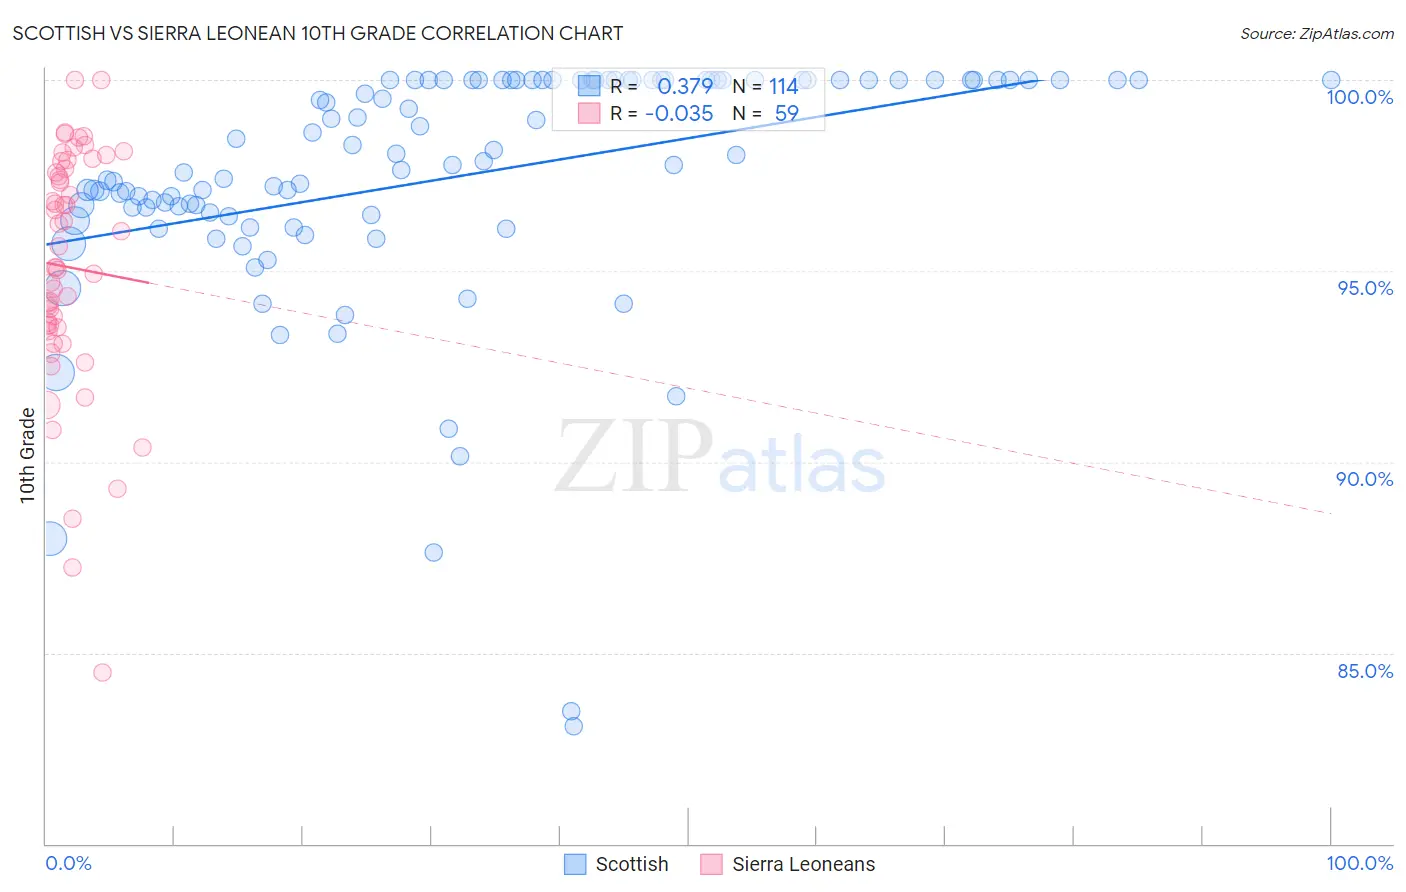
Scottish vs Sierra Leonean 10th Grade Correlation Chart
The statistical analysis conducted on geographies consisting of 567,140,525 people shows a mild positive correlation between the proportion of Scottish and percentage of population with at least 10th grade education in the United States with a correlation coefficient (R) of 0.379 and weighted average of 95.6%. Similarly, the statistical analysis conducted on geographies consisting of 83,357,120 people shows no correlation between the proportion of Sierra Leoneans and percentage of population with at least 10th grade education in the United States with a correlation coefficient (R) of -0.035 and weighted average of 93.7%, a difference of 2.0%.
10th Grade Correlation Summary
| Measurement | Scottish | Sierra Leonean |
| Minimum | 83.1% | 84.5% |
| Maximum | 100.0% | 100.0% |
| Range | 16.9% | 15.5% |
| Mean | 97.5% | 95.1% |
| Median | 97.9% | 95.1% |
| Interquartile 25% (IQ1) | 96.5% | 93.5% |
| Interquartile 75% (IQ3) | 100.0% | 97.7% |
| Interquartile Range (IQR) | 3.5% | 4.2% |
| Standard Deviation (Sample) | 3.2% | 3.2% |
| Standard Deviation (Population) | 3.2% | 3.1% |
Similar Demographics by 10th Grade
Demographics Similar to Scottish by 10th Grade
In terms of 10th grade, the demographic groups most similar to Scottish are Irish (95.6%, a difference of 0.010%), Latvian (95.6%, a difference of 0.010%), Italian (95.6%, a difference of 0.020%), Scandinavian (95.6%, a difference of 0.020%), and Tsimshian (95.6%, a difference of 0.030%).
| Demographics | Rating | Rank | 10th Grade |
| Finns | 100.0 /100 | #9 | Exceptional 95.8% |
| Croatians | 100.0 /100 | #10 | Exceptional 95.7% |
| Danes | 100.0 /100 | #11 | Exceptional 95.7% |
| Tlingit-Haida | 100.0 /100 | #12 | Exceptional 95.7% |
| English | 100.0 /100 | #13 | Exceptional 95.6% |
| Tsimshian | 100.0 /100 | #14 | Exceptional 95.6% |
| Irish | 100.0 /100 | #15 | Exceptional 95.6% |
| Scottish | 100.0 /100 | #16 | Exceptional 95.6% |
| Latvians | 100.0 /100 | #17 | Exceptional 95.6% |
| Italians | 100.0 /100 | #18 | Exceptional 95.6% |
| Scandinavians | 100.0 /100 | #19 | Exceptional 95.6% |
| Chinese | 100.0 /100 | #20 | Exceptional 95.5% |
| Dutch | 100.0 /100 | #21 | Exceptional 95.5% |
| Eastern Europeans | 100.0 /100 | #22 | Exceptional 95.5% |
| Czechs | 100.0 /100 | #23 | Exceptional 95.5% |
Demographics Similar to Sierra Leoneans by 10th Grade
In terms of 10th grade, the demographic groups most similar to Sierra Leoneans are Immigrants from Argentina (93.7%, a difference of 0.010%), Immigrants from Lebanon (93.7%, a difference of 0.010%), Paraguayan (93.7%, a difference of 0.010%), Argentinean (93.7%, a difference of 0.030%), and Immigrants from Nepal (93.7%, a difference of 0.030%).
| Demographics | Rating | Rank | 10th Grade |
| Immigrants | Albania | 52.4 /100 | #171 | Average 93.8% |
| French American Indians | 50.9 /100 | #172 | Average 93.7% |
| Spaniards | 50.3 /100 | #173 | Average 93.7% |
| Argentineans | 50.0 /100 | #174 | Average 93.7% |
| Immigrants | Nepal | 49.6 /100 | #175 | Average 93.7% |
| Immigrants | Argentina | 47.1 /100 | #176 | Average 93.7% |
| Immigrants | Lebanon | 47.1 /100 | #177 | Average 93.7% |
| Sierra Leoneans | 46.1 /100 | #178 | Average 93.7% |
| Paraguayans | 45.3 /100 | #179 | Average 93.7% |
| Blackfeet | 42.8 /100 | #180 | Average 93.7% |
| Immigrants | Northern Africa | 41.6 /100 | #181 | Average 93.7% |
| Colville | 38.8 /100 | #182 | Fair 93.6% |
| Guamanians/Chamorros | 37.1 /100 | #183 | Fair 93.6% |
| Choctaw | 36.6 /100 | #184 | Fair 93.6% |
| Sudanese | 36.6 /100 | #185 | Fair 93.6% |