Scottish vs Immigrants from Asia Currently Married
COMPARE
Scottish
Immigrants from Asia
Currently Married
Currently Married Comparison
Scottish
Immigrants from Asia
49.2%
CURRENTLY MARRIED
99.8/ 100
METRIC RATING
21st/ 347
METRIC RANK
48.3%
CURRENTLY MARRIED
97.9/ 100
METRIC RATING
70th/ 347
METRIC RANK
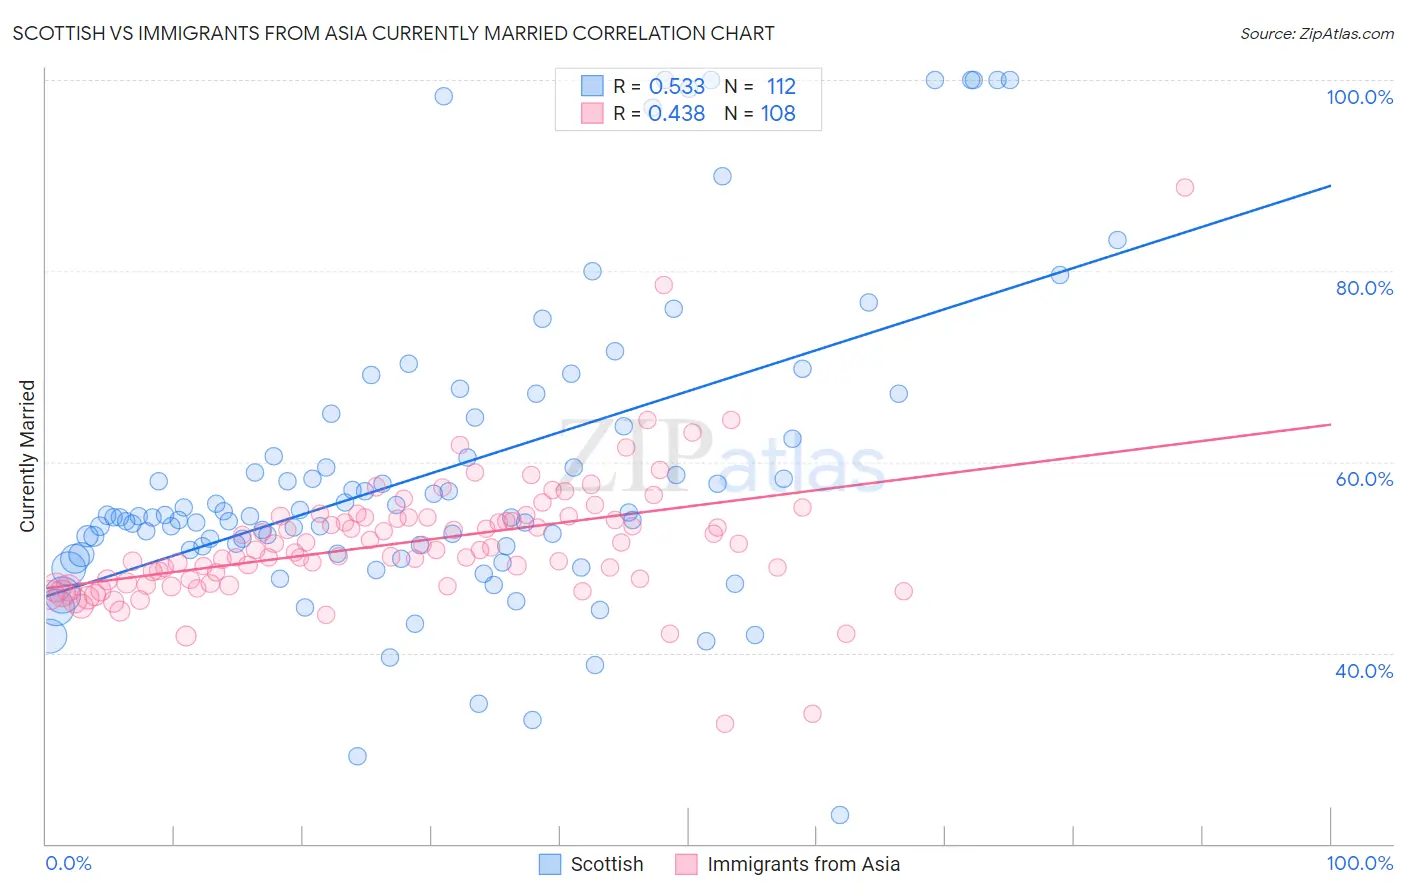
Scottish vs Immigrants from Asia Currently Married Correlation Chart
The statistical analysis conducted on geographies consisting of 567,020,693 people shows a substantial positive correlation between the proportion of Scottish and percentage of population currently married in the United States with a correlation coefficient (R) of 0.533 and weighted average of 49.2%. Similarly, the statistical analysis conducted on geographies consisting of 549,041,877 people shows a moderate positive correlation between the proportion of Immigrants from Asia and percentage of population currently married in the United States with a correlation coefficient (R) of 0.438 and weighted average of 48.3%, a difference of 1.9%.
Currently Married Correlation Summary
| Measurement | Scottish | Immigrants from Asia |
| Minimum | 23.0% | 32.6% |
| Maximum | 100.0% | 88.7% |
| Range | 77.0% | 56.1% |
| Mean | 59.0% | 51.6% |
| Median | 54.2% | 50.8% |
| Interquartile 25% (IQ1) | 51.0% | 47.5% |
| Interquartile 75% (IQ3) | 63.0% | 54.2% |
| Interquartile Range (IQR) | 12.1% | 6.7% |
| Standard Deviation (Sample) | 16.3% | 6.9% |
| Standard Deviation (Population) | 16.2% | 6.9% |
Similar Demographics by Currently Married
Demographics Similar to Scottish by Currently Married
In terms of currently married, the demographic groups most similar to Scottish are Luxembourger (49.3%, a difference of 0.11%), Bulgarian (49.1%, a difference of 0.22%), European (49.3%, a difference of 0.24%), Immigrants from Scotland (49.3%, a difference of 0.26%), and Immigrants from Pakistan (49.1%, a difference of 0.33%).
| Demographics | Rating | Rank | Currently Married |
| Germans | 99.9 /100 | #14 | Exceptional 49.6% |
| Pennsylvania Germans | 99.9 /100 | #15 | Exceptional 49.6% |
| Chinese | 99.9 /100 | #16 | Exceptional 49.5% |
| Scandinavians | 99.9 /100 | #17 | Exceptional 49.5% |
| Immigrants | Scotland | 99.8 /100 | #18 | Exceptional 49.3% |
| Europeans | 99.8 /100 | #19 | Exceptional 49.3% |
| Luxembourgers | 99.8 /100 | #20 | Exceptional 49.3% |
| Scottish | 99.8 /100 | #21 | Exceptional 49.2% |
| Bulgarians | 99.7 /100 | #22 | Exceptional 49.1% |
| Immigrants | Pakistan | 99.7 /100 | #23 | Exceptional 49.1% |
| Lithuanians | 99.6 /100 | #24 | Exceptional 49.0% |
| Maltese | 99.6 /100 | #25 | Exceptional 49.0% |
| Immigrants | Korea | 99.6 /100 | #26 | Exceptional 49.0% |
| Burmese | 99.6 /100 | #27 | Exceptional 48.9% |
| Welsh | 99.5 /100 | #28 | Exceptional 48.9% |
Demographics Similar to Immigrants from Asia by Currently Married
In terms of currently married, the demographic groups most similar to Immigrants from Asia are Macedonian (48.3%, a difference of 0.010%), Canadian (48.3%, a difference of 0.090%), Immigrants from England (48.3%, a difference of 0.10%), Slovak (48.3%, a difference of 0.11%), and Tongan (48.3%, a difference of 0.12%).
| Demographics | Rating | Rank | Currently Married |
| Slavs | 98.3 /100 | #63 | Exceptional 48.4% |
| Immigrants | Czechoslovakia | 98.3 /100 | #64 | Exceptional 48.4% |
| Ukrainians | 98.3 /100 | #65 | Exceptional 48.4% |
| Tongans | 98.2 /100 | #66 | Exceptional 48.3% |
| Slovaks | 98.2 /100 | #67 | Exceptional 48.3% |
| Immigrants | England | 98.2 /100 | #68 | Exceptional 48.3% |
| Canadians | 98.1 /100 | #69 | Exceptional 48.3% |
| Immigrants | Asia | 97.9 /100 | #70 | Exceptional 48.3% |
| Macedonians | 97.9 /100 | #71 | Exceptional 48.3% |
| Immigrants | Lebanon | 97.6 /100 | #72 | Exceptional 48.2% |
| Immigrants | Eastern Asia | 97.5 /100 | #73 | Exceptional 48.2% |
| Estonians | 97.4 /100 | #74 | Exceptional 48.2% |
| Immigrants | Belarus | 97.2 /100 | #75 | Exceptional 48.1% |
| Basques | 97.2 /100 | #76 | Exceptional 48.1% |
| Slovenes | 97.1 /100 | #77 | Exceptional 48.1% |