Scottish vs Cherokee Currently Married
COMPARE
Scottish
Cherokee
Currently Married
Currently Married Comparison
Scottish
Cherokee
49.2%
CURRENTLY MARRIED
99.8/ 100
METRIC RATING
21st/ 347
METRIC RANK
46.9%
CURRENTLY MARRIED
66.8/ 100
METRIC RATING
158th/ 347
METRIC RANK
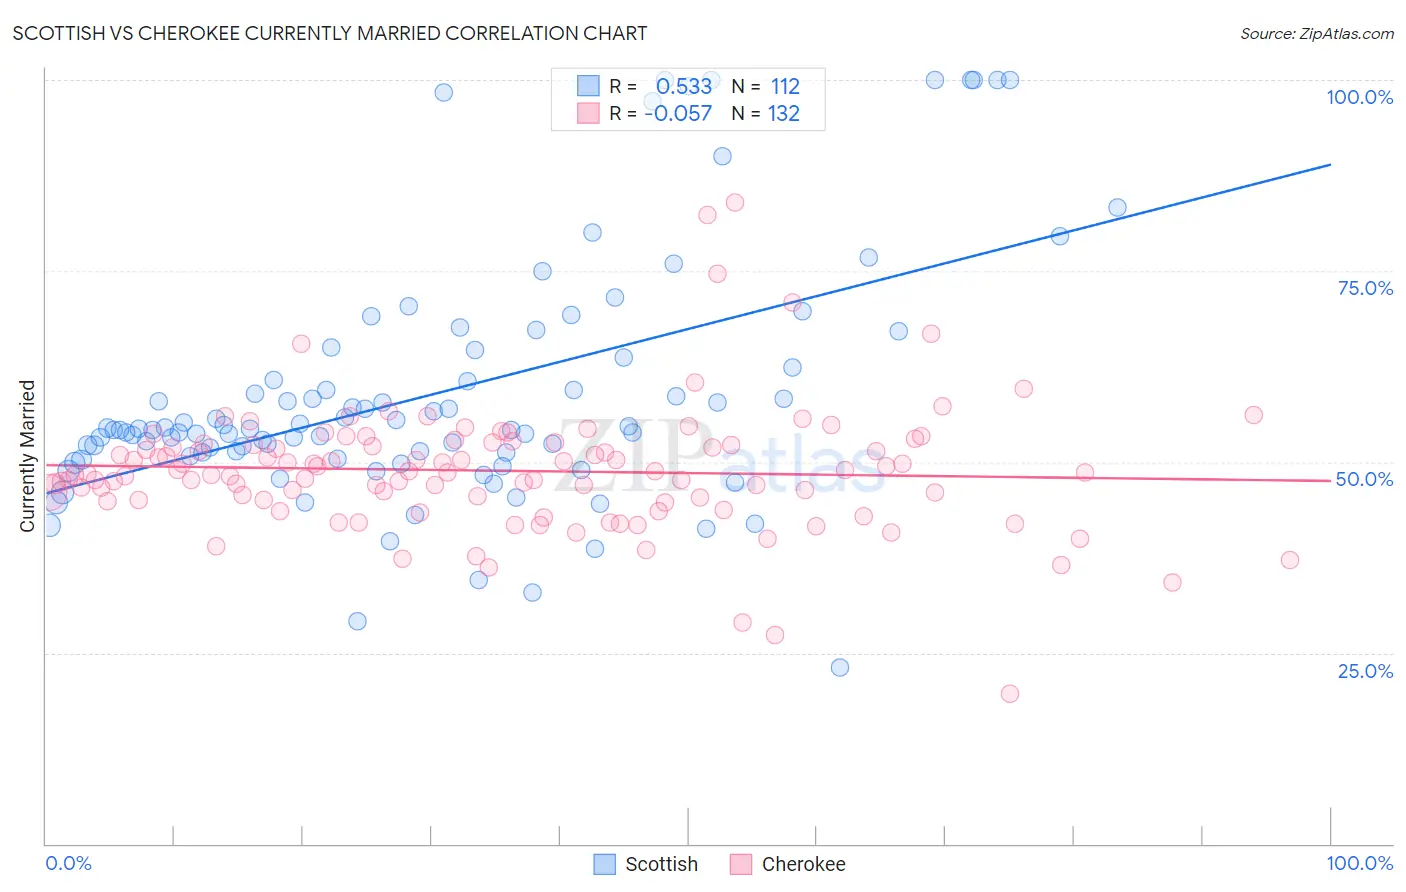
Scottish vs Cherokee Currently Married Correlation Chart
The statistical analysis conducted on geographies consisting of 567,020,693 people shows a substantial positive correlation between the proportion of Scottish and percentage of population currently married in the United States with a correlation coefficient (R) of 0.533 and weighted average of 49.2%. Similarly, the statistical analysis conducted on geographies consisting of 493,651,185 people shows a slight negative correlation between the proportion of Cherokee and percentage of population currently married in the United States with a correlation coefficient (R) of -0.057 and weighted average of 46.9%, a difference of 4.9%.
Currently Married Correlation Summary
| Measurement | Scottish | Cherokee |
| Minimum | 23.0% | 19.6% |
| Maximum | 100.0% | 84.0% |
| Range | 77.0% | 64.4% |
| Mean | 59.0% | 48.8% |
| Median | 54.2% | 48.6% |
| Interquartile 25% (IQ1) | 51.0% | 45.0% |
| Interquartile 75% (IQ3) | 63.0% | 52.3% |
| Interquartile Range (IQR) | 12.1% | 7.4% |
| Standard Deviation (Sample) | 16.3% | 8.4% |
| Standard Deviation (Population) | 16.2% | 8.4% |
Similar Demographics by Currently Married
Demographics Similar to Scottish by Currently Married
In terms of currently married, the demographic groups most similar to Scottish are Luxembourger (49.3%, a difference of 0.11%), Bulgarian (49.1%, a difference of 0.22%), European (49.3%, a difference of 0.24%), Immigrants from Scotland (49.3%, a difference of 0.26%), and Immigrants from Pakistan (49.1%, a difference of 0.33%).
| Demographics | Rating | Rank | Currently Married |
| Germans | 99.9 /100 | #14 | Exceptional 49.6% |
| Pennsylvania Germans | 99.9 /100 | #15 | Exceptional 49.6% |
| Chinese | 99.9 /100 | #16 | Exceptional 49.5% |
| Scandinavians | 99.9 /100 | #17 | Exceptional 49.5% |
| Immigrants | Scotland | 99.8 /100 | #18 | Exceptional 49.3% |
| Europeans | 99.8 /100 | #19 | Exceptional 49.3% |
| Luxembourgers | 99.8 /100 | #20 | Exceptional 49.3% |
| Scottish | 99.8 /100 | #21 | Exceptional 49.2% |
| Bulgarians | 99.7 /100 | #22 | Exceptional 49.1% |
| Immigrants | Pakistan | 99.7 /100 | #23 | Exceptional 49.1% |
| Lithuanians | 99.6 /100 | #24 | Exceptional 49.0% |
| Maltese | 99.6 /100 | #25 | Exceptional 49.0% |
| Immigrants | Korea | 99.6 /100 | #26 | Exceptional 49.0% |
| Burmese | 99.6 /100 | #27 | Exceptional 48.9% |
| Welsh | 99.5 /100 | #28 | Exceptional 48.9% |
Demographics Similar to Cherokee by Currently Married
In terms of currently married, the demographic groups most similar to Cherokee are Iraqi (46.9%, a difference of 0.020%), Immigrants from Uzbekistan (46.9%, a difference of 0.030%), Immigrants from Southern Europe (46.9%, a difference of 0.030%), Immigrants from Switzerland (46.9%, a difference of 0.040%), and Spanish (47.0%, a difference of 0.050%).
| Demographics | Rating | Rank | Currently Married |
| Chileans | 69.8 /100 | #151 | Good 47.0% |
| Immigrants | Serbia | 68.8 /100 | #152 | Good 47.0% |
| Immigrants | Venezuela | 68.6 /100 | #153 | Good 47.0% |
| Albanians | 68.6 /100 | #154 | Good 47.0% |
| Arabs | 68.6 /100 | #155 | Good 47.0% |
| Spanish | 68.1 /100 | #156 | Good 47.0% |
| Immigrants | Switzerland | 67.8 /100 | #157 | Good 46.9% |
| Cherokee | 66.8 /100 | #158 | Good 46.9% |
| Iraqis | 66.4 /100 | #159 | Good 46.9% |
| Immigrants | Uzbekistan | 66.0 /100 | #160 | Good 46.9% |
| Immigrants | Southern Europe | 65.9 /100 | #161 | Good 46.9% |
| Immigrants | Nonimmigrants | 65.4 /100 | #162 | Good 46.9% |
| Delaware | 64.7 /100 | #163 | Good 46.9% |
| Immigrants | Western Asia | 64.2 /100 | #164 | Good 46.9% |
| Samoans | 59.8 /100 | #165 | Average 46.8% |