Alaskan Athabascan vs Immigrants from Congo Average Family Size
COMPARE
Alaskan Athabascan
Immigrants from Congo
Average Family Size
Average Family Size Comparison
Alaskan Athabascans
Immigrants from Congo
3.27
AVERAGE FAMILY SIZE
92.4/ 100
METRIC RATING
123rd/ 347
METRIC RANK
3.23
AVERAGE FAMILY SIZE
52.7/ 100
METRIC RATING
172nd/ 347
METRIC RANK
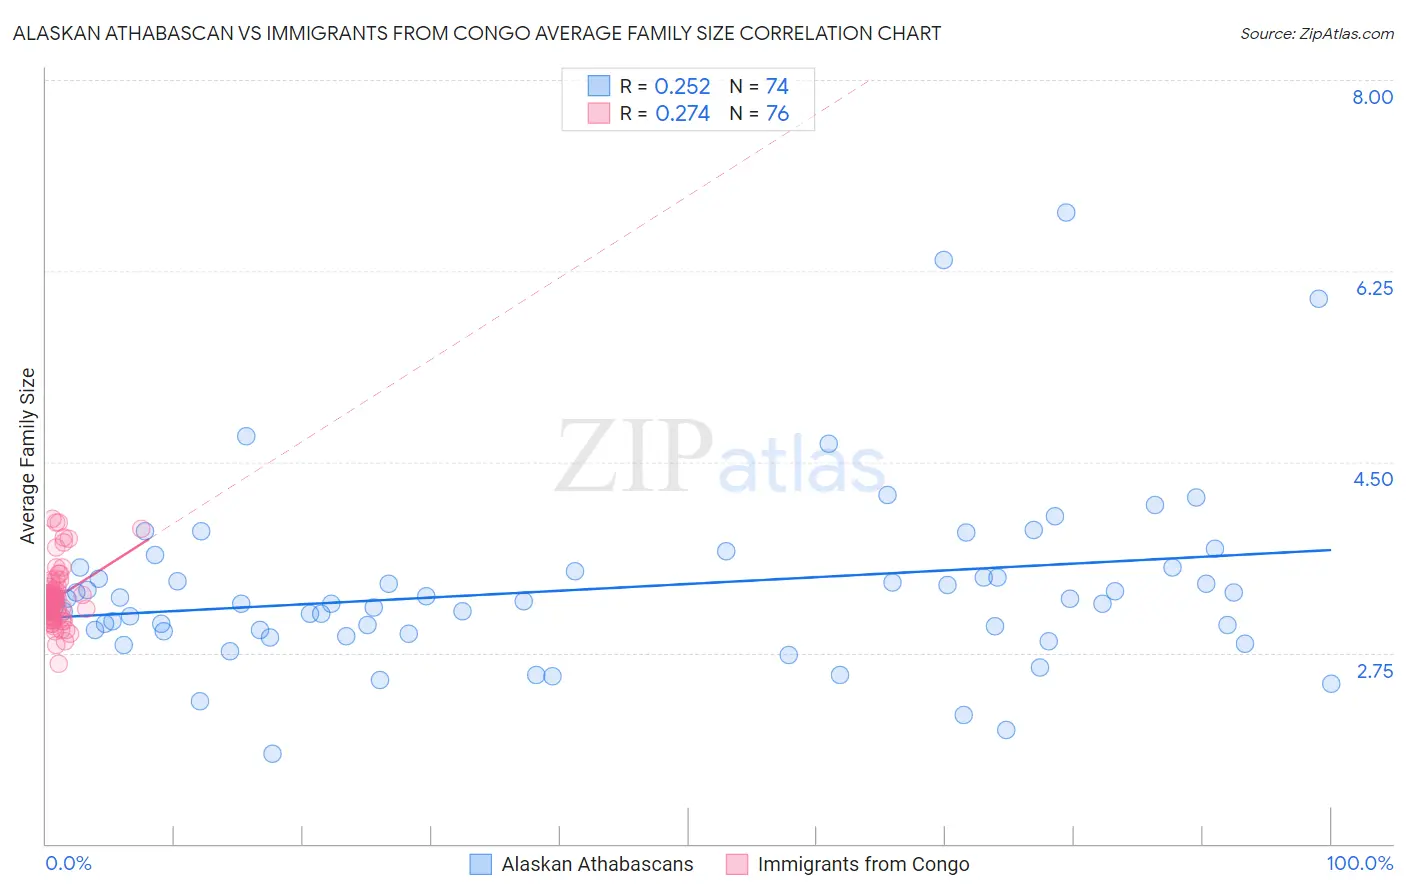
Alaskan Athabascan vs Immigrants from Congo Average Family Size Correlation Chart
The statistical analysis conducted on geographies consisting of 45,814,644 people shows a weak positive correlation between the proportion of Alaskan Athabascans and average family size in the United States with a correlation coefficient (R) of 0.252 and weighted average of 3.27. Similarly, the statistical analysis conducted on geographies consisting of 92,087,751 people shows a weak positive correlation between the proportion of Immigrants from Congo and average family size in the United States with a correlation coefficient (R) of 0.274 and weighted average of 3.23, a difference of 1.1%.
Average Family Size Correlation Summary
| Measurement | Alaskan Athabascan | Immigrants from Congo |
| Minimum | 1.83 | 2.65 |
| Maximum | 6.79 | 3.97 |
| Range | 4.96 | 1.32 |
| Mean | 3.34 | 3.25 |
| Median | 3.21 | 3.21 |
| Interquartile 25% (IQ1) | 2.95 | 3.09 |
| Interquartile 75% (IQ3) | 3.50 | 3.32 |
| Interquartile Range (IQR) | 0.55 | 0.23 |
| Standard Deviation (Sample) | 0.82 | 0.26 |
| Standard Deviation (Population) | 0.82 | 0.26 |
Similar Demographics by Average Family Size
Demographics Similar to Alaskan Athabascans by Average Family Size
In terms of average family size, the demographic groups most similar to Alaskan Athabascans are Immigrants from Colombia (3.27, a difference of 0.020%), South American Indian (3.26, a difference of 0.050%), Immigrants from Thailand (3.27, a difference of 0.060%), Immigrants from Cuba (3.26, a difference of 0.070%), and Immigrants from Bahamas (3.27, a difference of 0.080%).
| Demographics | Rating | Rank | Average Family Size |
| Immigrants | South America | 95.0 /100 | #116 | Exceptional 3.27 |
| Kiowa | 94.8 /100 | #117 | Exceptional 3.27 |
| Immigrants | Asia | 94.0 /100 | #118 | Exceptional 3.27 |
| Immigrants | Indonesia | 93.7 /100 | #119 | Exceptional 3.27 |
| Immigrants | Bahamas | 93.6 /100 | #120 | Exceptional 3.27 |
| Immigrants | Thailand | 93.3 /100 | #121 | Exceptional 3.27 |
| Immigrants | Colombia | 92.8 /100 | #122 | Exceptional 3.27 |
| Alaskan Athabascans | 92.4 /100 | #123 | Exceptional 3.27 |
| South American Indians | 91.6 /100 | #124 | Exceptional 3.26 |
| Immigrants | Cuba | 91.3 /100 | #125 | Exceptional 3.26 |
| Immigrants | Costa Rica | 90.7 /100 | #126 | Exceptional 3.26 |
| Immigrants | Syria | 90.6 /100 | #127 | Exceptional 3.26 |
| Colombians | 89.9 /100 | #128 | Excellent 3.26 |
| Immigrants | Hong Kong | 88.6 /100 | #129 | Excellent 3.26 |
| Laotians | 88.5 /100 | #130 | Excellent 3.26 |
Demographics Similar to Immigrants from Congo by Average Family Size
In terms of average family size, the demographic groups most similar to Immigrants from Congo are Chilean (3.23, a difference of 0.010%), Immigrants from Uruguay (3.23, a difference of 0.010%), Arab (3.23, a difference of 0.020%), Taiwanese (3.23, a difference of 0.030%), and Aleut (3.23, a difference of 0.030%).
| Demographics | Rating | Rank | Average Family Size |
| Ugandans | 58.4 /100 | #165 | Average 3.23 |
| Immigrants | Senegal | 57.5 /100 | #166 | Average 3.23 |
| Dutch West Indians | 56.9 /100 | #167 | Average 3.23 |
| Taiwanese | 54.2 /100 | #168 | Average 3.23 |
| Aleuts | 54.1 /100 | #169 | Average 3.23 |
| Arabs | 53.8 /100 | #170 | Average 3.23 |
| Chileans | 53.2 /100 | #171 | Average 3.23 |
| Immigrants | Congo | 52.7 /100 | #172 | Average 3.23 |
| Immigrants | Uruguay | 52.0 /100 | #173 | Average 3.23 |
| Immigrants | South Central Asia | 50.0 /100 | #174 | Average 3.23 |
| Immigrants | China | 49.9 /100 | #175 | Average 3.23 |
| Israelis | 48.7 /100 | #176 | Average 3.23 |
| Argentineans | 47.4 /100 | #177 | Average 3.23 |
| Spaniards | 47.2 /100 | #178 | Average 3.23 |
| Immigrants | Korea | 46.9 /100 | #179 | Average 3.23 |