Immigrants from Eritrea vs Cajun Average Family Size
COMPARE
Immigrants from Eritrea
Cajun
Average Family Size
Average Family Size Comparison
Immigrants from Eritrea
Cajuns
3.24
AVERAGE FAMILY SIZE
71.4/ 100
METRIC RATING
153rd/ 347
METRIC RANK
3.17
AVERAGE FAMILY SIZE
2.4/ 100
METRIC RATING
247th/ 347
METRIC RANK
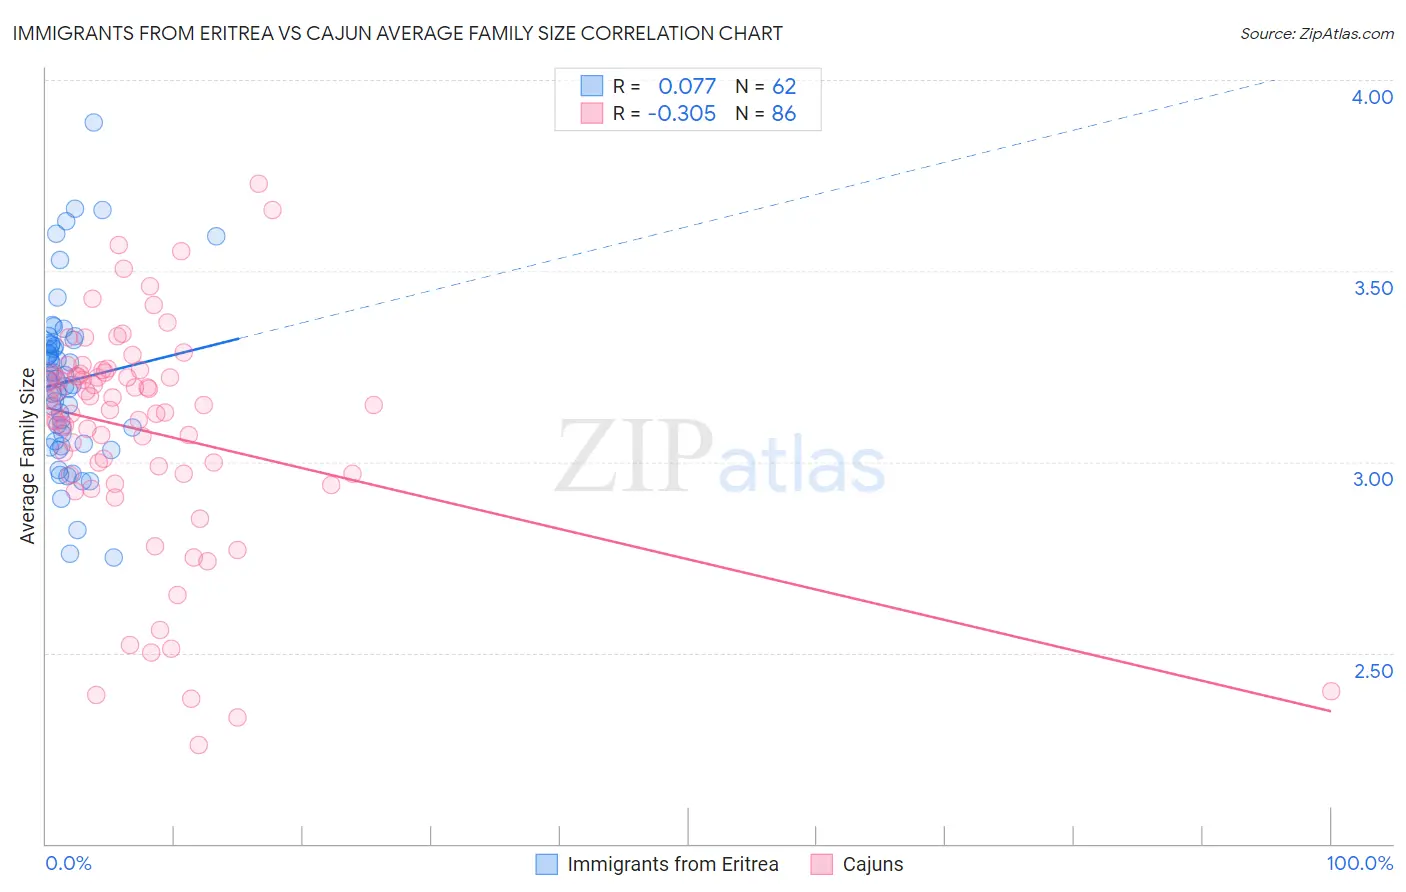
Immigrants from Eritrea vs Cajun Average Family Size Correlation Chart
The statistical analysis conducted on geographies consisting of 104,794,375 people shows a slight positive correlation between the proportion of Immigrants from Eritrea and average family size in the United States with a correlation coefficient (R) of 0.077 and weighted average of 3.24. Similarly, the statistical analysis conducted on geographies consisting of 149,695,466 people shows a mild negative correlation between the proportion of Cajuns and average family size in the United States with a correlation coefficient (R) of -0.305 and weighted average of 3.17, a difference of 2.1%.
Average Family Size Correlation Summary
| Measurement | Immigrants from Eritrea | Cajun |
| Minimum | 2.75 | 2.26 |
| Maximum | 3.89 | 3.73 |
| Range | 1.14 | 1.47 |
| Mean | 3.21 | 3.08 |
| Median | 3.21 | 3.14 |
| Interquartile 25% (IQ1) | 3.05 | 2.97 |
| Interquartile 75% (IQ3) | 3.31 | 3.23 |
| Interquartile Range (IQR) | 0.25 | 0.26 |
| Standard Deviation (Sample) | 0.22 | 0.30 |
| Standard Deviation (Population) | 0.22 | 0.29 |
Similar Demographics by Average Family Size
Demographics Similar to Immigrants from Eritrea by Average Family Size
In terms of average family size, the demographic groups most similar to Immigrants from Eritrea are Spanish American (3.24, a difference of 0.020%), Immigrants from Egypt (3.24, a difference of 0.030%), Assyrian/Chaldean/Syriac (3.24, a difference of 0.050%), Indian (Asian) (3.24, a difference of 0.050%), and Jordanian (3.24, a difference of 0.050%).
| Demographics | Rating | Rank | Average Family Size |
| Immigrants | Africa | 77.9 /100 | #146 | Good 3.25 |
| Immigrants | Jordan | 75.7 /100 | #147 | Good 3.24 |
| Blackfeet | 75.0 /100 | #148 | Good 3.24 |
| Assyrians/Chaldeans/Syriacs | 73.8 /100 | #149 | Good 3.24 |
| Indians (Asian) | 73.6 /100 | #150 | Good 3.24 |
| Jordanians | 73.5 /100 | #151 | Good 3.24 |
| Spanish Americans | 72.5 /100 | #152 | Good 3.24 |
| Immigrants | Eritrea | 71.4 /100 | #153 | Good 3.24 |
| Immigrants | Egypt | 70.0 /100 | #154 | Good 3.24 |
| Seminole | 68.2 /100 | #155 | Good 3.24 |
| Immigrants | Taiwan | 68.1 /100 | #156 | Good 3.24 |
| Immigrants | Uzbekistan | 67.0 /100 | #157 | Good 3.24 |
| Iraqis | 64.3 /100 | #158 | Good 3.24 |
| Ethiopians | 63.9 /100 | #159 | Good 3.24 |
| Immigrants | Iraq | 63.7 /100 | #160 | Good 3.24 |
Demographics Similar to Cajuns by Average Family Size
In terms of average family size, the demographic groups most similar to Cajuns are Danish (3.17, a difference of 0.010%), Immigrants from Belarus (3.17, a difference of 0.030%), Immigrants from Brazil (3.18, a difference of 0.050%), Immigrants from Eastern Europe (3.17, a difference of 0.070%), and Immigrants from Southern Europe (3.18, a difference of 0.080%).
| Demographics | Rating | Rank | Average Family Size |
| Osage | 3.2 /100 | #240 | Tragic 3.18 |
| Immigrants | Japan | 3.0 /100 | #241 | Tragic 3.18 |
| Hungarians | 3.0 /100 | #242 | Tragic 3.18 |
| Immigrants | Moldova | 2.9 /100 | #243 | Tragic 3.18 |
| Immigrants | Southern Europe | 2.9 /100 | #244 | Tragic 3.18 |
| Immigrants | Brazil | 2.7 /100 | #245 | Tragic 3.18 |
| Danes | 2.5 /100 | #246 | Tragic 3.17 |
| Cajuns | 2.4 /100 | #247 | Tragic 3.17 |
| Immigrants | Belarus | 2.3 /100 | #248 | Tragic 3.17 |
| Immigrants | Eastern Europe | 2.1 /100 | #249 | Tragic 3.17 |
| Puget Sound Salish | 1.9 /100 | #250 | Tragic 3.17 |
| Immigrants | Spain | 1.8 /100 | #251 | Tragic 3.17 |
| Immigrants | Saudi Arabia | 1.7 /100 | #252 | Tragic 3.17 |
| South Africans | 1.7 /100 | #253 | Tragic 3.17 |
| Immigrants | Hungary | 1.7 /100 | #254 | Tragic 3.17 |