Scotch-Irish vs Cajun 12th Grade, No Diploma
COMPARE
Scotch-Irish
Cajun
12th Grade, No Diploma
12th Grade, No Diploma Comparison
Scotch-Irish
Cajuns
92.4%
12TH GRADE, NO DIPLOMA
98.8/ 100
METRIC RATING
88th/ 347
METRIC RANK
89.1%
12TH GRADE, NO DIPLOMA
0.1/ 100
METRIC RATING
274th/ 347
METRIC RANK
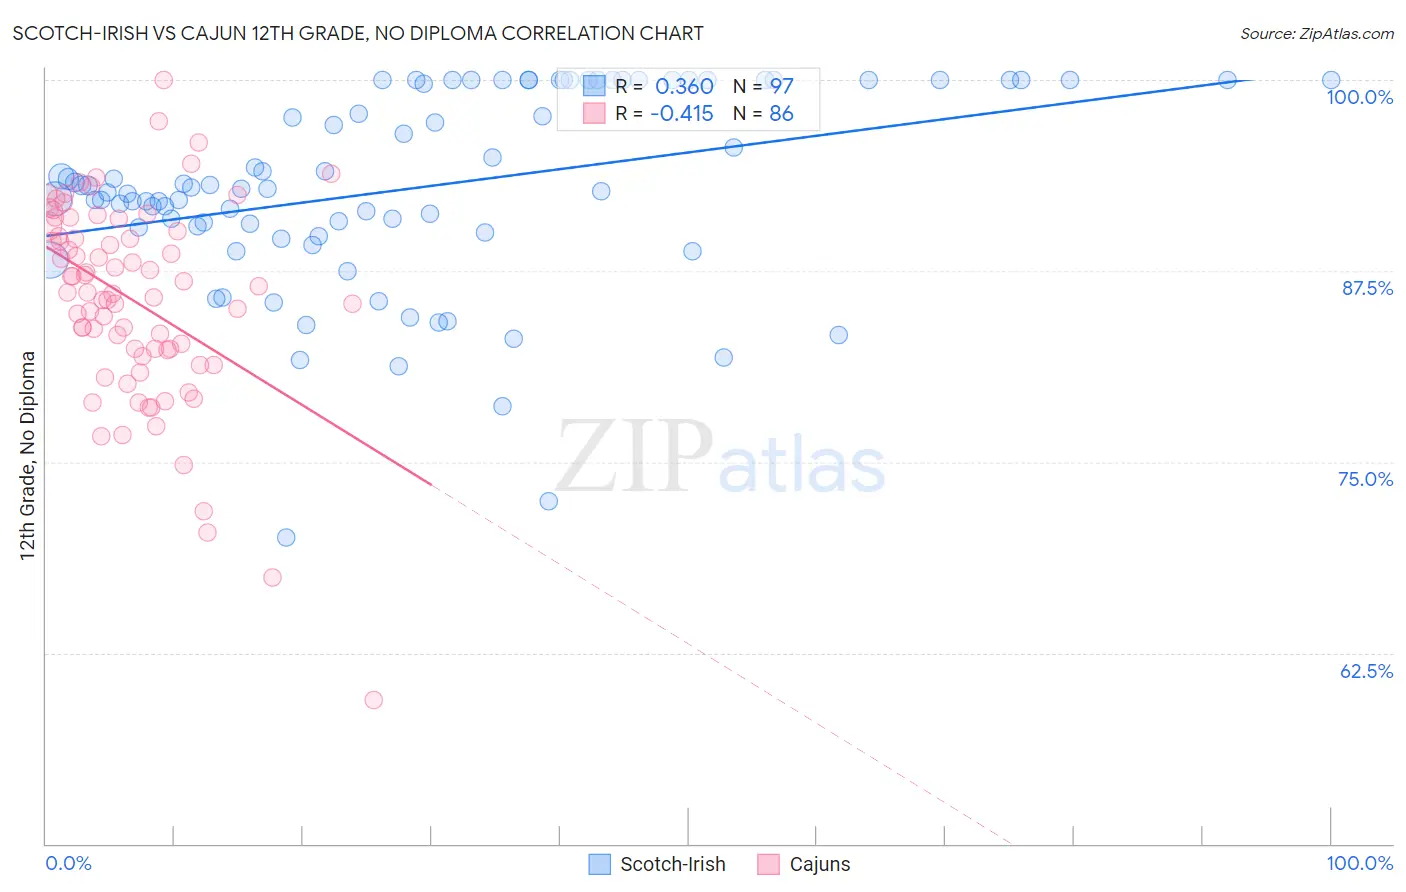
Scotch-Irish vs Cajun 12th Grade, No Diploma Correlation Chart
The statistical analysis conducted on geographies consisting of 548,779,904 people shows a mild positive correlation between the proportion of Scotch-Irish and percentage of population with at least 12th grade (no diploma) education in the United States with a correlation coefficient (R) of 0.360 and weighted average of 92.4%. Similarly, the statistical analysis conducted on geographies consisting of 149,713,149 people shows a moderate negative correlation between the proportion of Cajuns and percentage of population with at least 12th grade (no diploma) education in the United States with a correlation coefficient (R) of -0.415 and weighted average of 89.1%, a difference of 3.7%.
12th Grade, No Diploma Correlation Summary
| Measurement | Scotch-Irish | Cajun |
| Minimum | 70.0% | 59.4% |
| Maximum | 100.0% | 100.0% |
| Range | 30.0% | 40.6% |
| Mean | 92.9% | 85.6% |
| Median | 92.9% | 86.1% |
| Interquartile 25% (IQ1) | 90.2% | 82.3% |
| Interquartile 75% (IQ3) | 100.0% | 90.1% |
| Interquartile Range (IQR) | 9.8% | 7.8% |
| Standard Deviation (Sample) | 6.4% | 6.6% |
| Standard Deviation (Population) | 6.4% | 6.6% |
Similar Demographics by 12th Grade, No Diploma
Demographics Similar to Scotch-Irish by 12th Grade, No Diploma
In terms of 12th grade, no diploma, the demographic groups most similar to Scotch-Irish are Immigrants from France (92.4%, a difference of 0.010%), Immigrants from Turkey (92.4%, a difference of 0.030%), Canadian (92.4%, a difference of 0.030%), Immigrants from Serbia (92.4%, a difference of 0.040%), and South African (92.4%, a difference of 0.040%).
| Demographics | Rating | Rank | 12th Grade, No Diploma |
| Immigrants | Denmark | 99.2 /100 | #81 | Exceptional 92.5% |
| Immigrants | Switzerland | 99.2 /100 | #82 | Exceptional 92.5% |
| Immigrants | Israel | 99.2 /100 | #83 | Exceptional 92.5% |
| Immigrants | Bulgaria | 99.1 /100 | #84 | Exceptional 92.5% |
| Immigrants | Saudi Arabia | 99.0 /100 | #85 | Exceptional 92.5% |
| Immigrants | Turkey | 98.9 /100 | #86 | Exceptional 92.4% |
| Immigrants | France | 98.8 /100 | #87 | Exceptional 92.4% |
| Scotch-Irish | 98.8 /100 | #88 | Exceptional 92.4% |
| Canadians | 98.7 /100 | #89 | Exceptional 92.4% |
| Immigrants | Serbia | 98.6 /100 | #90 | Exceptional 92.4% |
| South Africans | 98.6 /100 | #91 | Exceptional 92.4% |
| Immigrants | Romania | 98.5 /100 | #92 | Exceptional 92.3% |
| Immigrants | Western Europe | 98.5 /100 | #93 | Exceptional 92.3% |
| Immigrants | Europe | 98.5 /100 | #94 | Exceptional 92.3% |
| Immigrants | North Macedonia | 98.5 /100 | #95 | Exceptional 92.3% |
Demographics Similar to Cajuns by 12th Grade, No Diploma
In terms of 12th grade, no diploma, the demographic groups most similar to Cajuns are Barbadian (89.1%, a difference of 0.020%), Immigrants from Congo (89.0%, a difference of 0.070%), Ute (89.0%, a difference of 0.070%), Immigrants from Barbados (89.0%, a difference of 0.13%), and Malaysian (89.2%, a difference of 0.14%).
| Demographics | Rating | Rank | 12th Grade, No Diploma |
| West Indians | 0.2 /100 | #267 | Tragic 89.3% |
| Immigrants | Trinidad and Tobago | 0.1 /100 | #268 | Tragic 89.3% |
| U.S. Virgin Islanders | 0.1 /100 | #269 | Tragic 89.3% |
| Bangladeshis | 0.1 /100 | #270 | Tragic 89.3% |
| Blacks/African Americans | 0.1 /100 | #271 | Tragic 89.3% |
| Malaysians | 0.1 /100 | #272 | Tragic 89.2% |
| Barbadians | 0.1 /100 | #273 | Tragic 89.1% |
| Cajuns | 0.1 /100 | #274 | Tragic 89.1% |
| Immigrants | Congo | 0.1 /100 | #275 | Tragic 89.0% |
| Ute | 0.1 /100 | #276 | Tragic 89.0% |
| Immigrants | Barbados | 0.0 /100 | #277 | Tragic 89.0% |
| Immigrants | St. Vincent and the Grenadines | 0.0 /100 | #278 | Tragic 88.9% |
| Immigrants | Laos | 0.0 /100 | #279 | Tragic 88.9% |
| Immigrants | Burma/Myanmar | 0.0 /100 | #280 | Tragic 88.9% |
| Cubans | 0.0 /100 | #281 | Tragic 88.9% |