Nicaraguan vs Afghan Average Family Size
COMPARE
Nicaraguan
Afghan
Average Family Size
Average Family Size Comparison
Nicaraguans
Afghans
3.36
AVERAGE FAMILY SIZE
100.0/ 100
METRIC RATING
51st/ 347
METRIC RANK
3.31
AVERAGE FAMILY SIZE
99.7/ 100
METRIC RATING
85th/ 347
METRIC RANK
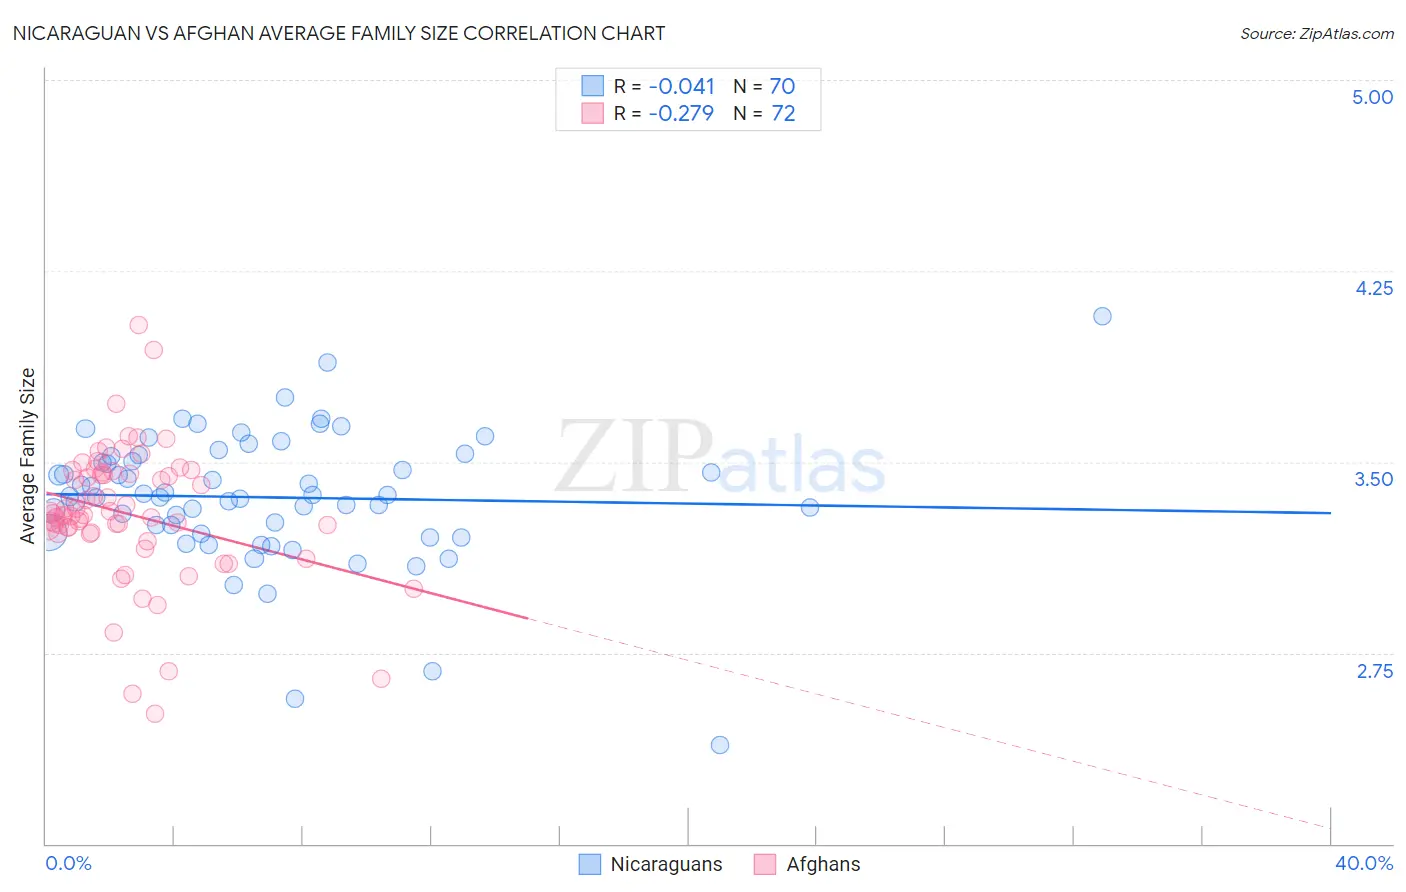
Nicaraguan vs Afghan Average Family Size Correlation Chart
The statistical analysis conducted on geographies consisting of 285,625,461 people shows no correlation between the proportion of Nicaraguans and average family size in the United States with a correlation coefficient (R) of -0.041 and weighted average of 3.36. Similarly, the statistical analysis conducted on geographies consisting of 148,832,546 people shows a weak negative correlation between the proportion of Afghans and average family size in the United States with a correlation coefficient (R) of -0.279 and weighted average of 3.31, a difference of 1.4%.
Average Family Size Correlation Summary
| Measurement | Nicaraguan | Afghan |
| Minimum | 2.39 | 2.51 |
| Maximum | 4.07 | 4.04 |
| Range | 1.68 | 1.53 |
| Mean | 3.36 | 3.30 |
| Median | 3.37 | 3.29 |
| Interquartile 25% (IQ1) | 3.22 | 3.22 |
| Interquartile 75% (IQ3) | 3.52 | 3.46 |
| Interquartile Range (IQR) | 0.30 | 0.23 |
| Standard Deviation (Sample) | 0.26 | 0.26 |
| Standard Deviation (Population) | 0.26 | 0.26 |
Similar Demographics by Average Family Size
Demographics Similar to Nicaraguans by Average Family Size
In terms of average family size, the demographic groups most similar to Nicaraguans are Fijian (3.36, a difference of 0.050%), Immigrants from Bangladesh (3.36, a difference of 0.070%), Korean (3.36, a difference of 0.090%), Immigrants from South Eastern Asia (3.36, a difference of 0.10%), and Immigrants from Honduras (3.36, a difference of 0.14%).
| Demographics | Rating | Rank | Average Family Size |
| Alaska Natives | 100.0 /100 | #44 | Exceptional 3.37 |
| Shoshone | 100.0 /100 | #45 | Exceptional 3.37 |
| Haitians | 100.0 /100 | #46 | Exceptional 3.37 |
| Vietnamese | 100.0 /100 | #47 | Exceptional 3.37 |
| Immigrants | Nicaragua | 100.0 /100 | #48 | Exceptional 3.37 |
| Bangladeshis | 100.0 /100 | #49 | Exceptional 3.37 |
| Immigrants | Bangladesh | 100.0 /100 | #50 | Exceptional 3.36 |
| Nicaraguans | 100.0 /100 | #51 | Exceptional 3.36 |
| Fijians | 100.0 /100 | #52 | Exceptional 3.36 |
| Koreans | 100.0 /100 | #53 | Exceptional 3.36 |
| Immigrants | South Eastern Asia | 100.0 /100 | #54 | Exceptional 3.36 |
| Immigrants | Honduras | 100.0 /100 | #55 | Exceptional 3.36 |
| Immigrants | Dominican Republic | 100.0 /100 | #56 | Exceptional 3.35 |
| Sri Lankans | 100.0 /100 | #57 | Exceptional 3.35 |
| Hondurans | 100.0 /100 | #58 | Exceptional 3.35 |
Demographics Similar to Afghans by Average Family Size
In terms of average family size, the demographic groups most similar to Afghans are Jamaican (3.31, a difference of 0.020%), Immigrants from Nigeria (3.32, a difference of 0.040%), Immigrants from Peru (3.31, a difference of 0.070%), Immigrants from Afghanistan (3.32, a difference of 0.080%), and Ecuadorian (3.32, a difference of 0.090%).
| Demographics | Rating | Rank | Average Family Size |
| Immigrants | Micronesia | 99.8 /100 | #78 | Exceptional 3.32 |
| British West Indians | 99.8 /100 | #79 | Exceptional 3.32 |
| Lumbee | 99.8 /100 | #80 | Exceptional 3.32 |
| Immigrants | Dominica | 99.8 /100 | #81 | Exceptional 3.32 |
| Ecuadorians | 99.8 /100 | #82 | Exceptional 3.32 |
| Immigrants | Afghanistan | 99.8 /100 | #83 | Exceptional 3.32 |
| Immigrants | Nigeria | 99.7 /100 | #84 | Exceptional 3.32 |
| Afghans | 99.7 /100 | #85 | Exceptional 3.31 |
| Jamaicans | 99.7 /100 | #86 | Exceptional 3.31 |
| Immigrants | Peru | 99.7 /100 | #87 | Exceptional 3.31 |
| Immigrants | Bolivia | 99.6 /100 | #88 | Exceptional 3.31 |
| Malaysians | 99.6 /100 | #89 | Exceptional 3.31 |
| Menominee | 99.4 /100 | #90 | Exceptional 3.30 |
| Immigrants | Pakistan | 99.2 /100 | #91 | Exceptional 3.30 |
| Immigrants | Cameroon | 99.2 /100 | #92 | Exceptional 3.30 |