Immigrants from Belarus vs Nonimmigrants Currently Married
COMPARE
Immigrants from Belarus
Nonimmigrants
Currently Married
Currently Married Comparison
Immigrants from Belarus
Nonimmigrants
48.1%
CURRENTLY MARRIED
97.2/ 100
METRIC RATING
75th/ 347
METRIC RANK
46.9%
CURRENTLY MARRIED
65.4/ 100
METRIC RATING
162nd/ 347
METRIC RANK
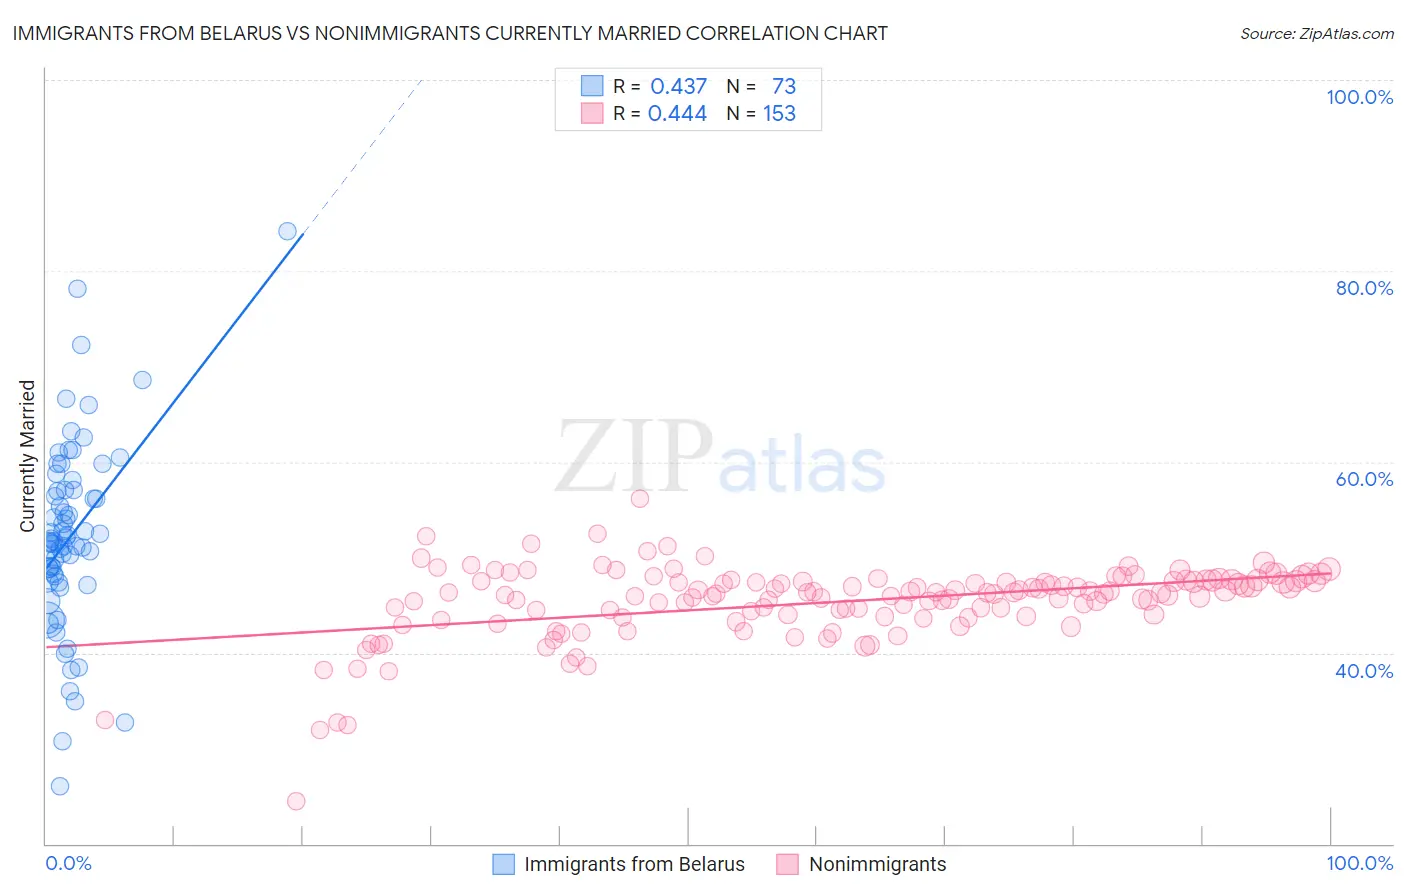
Immigrants from Belarus vs Nonimmigrants Currently Married Correlation Chart
The statistical analysis conducted on geographies consisting of 150,199,360 people shows a moderate positive correlation between the proportion of Immigrants from Belarus and percentage of population currently married in the United States with a correlation coefficient (R) of 0.437 and weighted average of 48.1%. Similarly, the statistical analysis conducted on geographies consisting of 585,180,453 people shows a moderate positive correlation between the proportion of Nonimmigrants and percentage of population currently married in the United States with a correlation coefficient (R) of 0.444 and weighted average of 46.9%, a difference of 2.6%.
Currently Married Correlation Summary
| Measurement | Immigrants from Belarus | Nonimmigrants |
| Minimum | 26.0% | 24.5% |
| Maximum | 84.2% | 56.2% |
| Range | 58.2% | 31.7% |
| Mean | 52.2% | 45.3% |
| Median | 51.7% | 46.3% |
| Interquartile 25% (IQ1) | 47.7% | 43.8% |
| Interquartile 75% (IQ3) | 57.0% | 47.5% |
| Interquartile Range (IQR) | 9.3% | 3.7% |
| Standard Deviation (Sample) | 9.9% | 4.0% |
| Standard Deviation (Population) | 9.8% | 4.0% |
Similar Demographics by Currently Married
Demographics Similar to Immigrants from Belarus by Currently Married
In terms of currently married, the demographic groups most similar to Immigrants from Belarus are Basque (48.1%, a difference of 0.020%), Slovene (48.1%, a difference of 0.050%), Immigrants from Belgium (48.1%, a difference of 0.050%), Estonian (48.2%, a difference of 0.070%), and Immigrants from South Africa (48.1%, a difference of 0.070%).
| Demographics | Rating | Rank | Currently Married |
| Immigrants | England | 98.2 /100 | #68 | Exceptional 48.3% |
| Canadians | 98.1 /100 | #69 | Exceptional 48.3% |
| Immigrants | Asia | 97.9 /100 | #70 | Exceptional 48.3% |
| Macedonians | 97.9 /100 | #71 | Exceptional 48.3% |
| Immigrants | Lebanon | 97.6 /100 | #72 | Exceptional 48.2% |
| Immigrants | Eastern Asia | 97.5 /100 | #73 | Exceptional 48.2% |
| Estonians | 97.4 /100 | #74 | Exceptional 48.2% |
| Immigrants | Belarus | 97.2 /100 | #75 | Exceptional 48.1% |
| Basques | 97.2 /100 | #76 | Exceptional 48.1% |
| Slovenes | 97.1 /100 | #77 | Exceptional 48.1% |
| Immigrants | Belgium | 97.1 /100 | #78 | Exceptional 48.1% |
| Immigrants | South Africa | 97.0 /100 | #79 | Exceptional 48.1% |
| Immigrants | Poland | 96.9 /100 | #80 | Exceptional 48.1% |
| Immigrants | Sri Lanka | 96.9 /100 | #81 | Exceptional 48.1% |
| Immigrants | Europe | 96.9 /100 | #82 | Exceptional 48.1% |
Demographics Similar to Nonimmigrants by Currently Married
In terms of currently married, the demographic groups most similar to Nonimmigrants are Immigrants from Uzbekistan (46.9%, a difference of 0.020%), Immigrants from Southern Europe (46.9%, a difference of 0.020%), Delaware (46.9%, a difference of 0.030%), Iraqi (46.9%, a difference of 0.040%), and Immigrants from Western Asia (46.9%, a difference of 0.050%).
| Demographics | Rating | Rank | Currently Married |
| Arabs | 68.6 /100 | #155 | Good 47.0% |
| Spanish | 68.1 /100 | #156 | Good 47.0% |
| Immigrants | Switzerland | 67.8 /100 | #157 | Good 46.9% |
| Cherokee | 66.8 /100 | #158 | Good 46.9% |
| Iraqis | 66.4 /100 | #159 | Good 46.9% |
| Immigrants | Uzbekistan | 66.0 /100 | #160 | Good 46.9% |
| Immigrants | Southern Europe | 65.9 /100 | #161 | Good 46.9% |
| Immigrants | Nonimmigrants | 65.4 /100 | #162 | Good 46.9% |
| Delaware | 64.7 /100 | #163 | Good 46.9% |
| Immigrants | Western Asia | 64.2 /100 | #164 | Good 46.9% |
| Samoans | 59.8 /100 | #165 | Average 46.8% |
| Immigrants | Syria | 59.3 /100 | #166 | Average 46.8% |
| Spaniards | 58.8 /100 | #167 | Average 46.8% |
| Immigrants | Afghanistan | 58.2 /100 | #168 | Average 46.8% |
| Armenians | 58.2 /100 | #169 | Average 46.8% |