U.S. Virgin Islander vs Nonimmigrants Currently Married
COMPARE
U.S. Virgin Islander
Nonimmigrants
Currently Married
Currently Married Comparison
U.S. Virgin Islanders
Nonimmigrants
40.7%
CURRENTLY MARRIED
0.0/ 100
METRIC RATING
325th/ 347
METRIC RANK
46.9%
CURRENTLY MARRIED
65.4/ 100
METRIC RATING
162nd/ 347
METRIC RANK
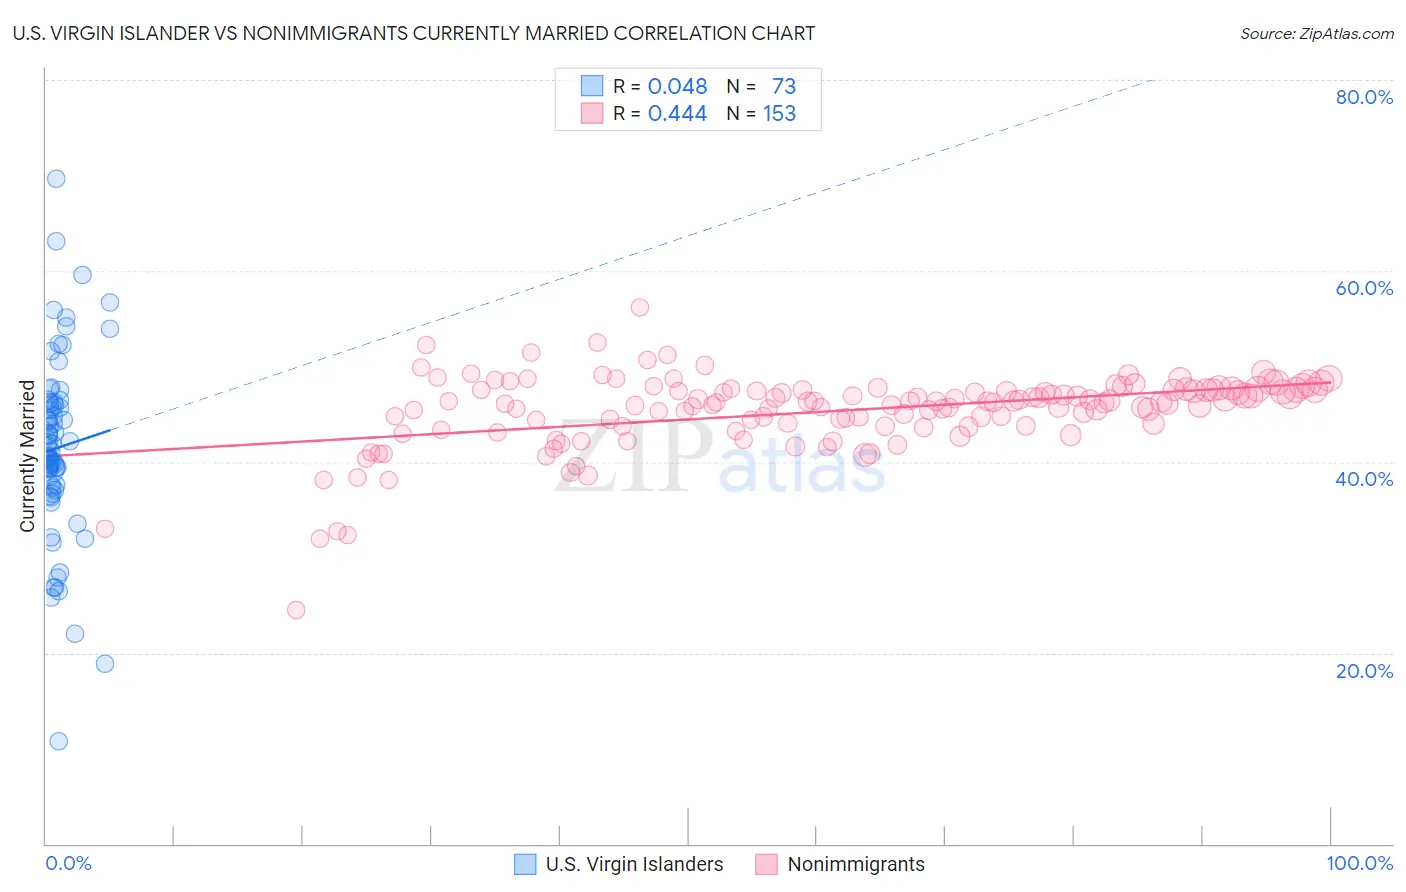
U.S. Virgin Islander vs Nonimmigrants Currently Married Correlation Chart
The statistical analysis conducted on geographies consisting of 87,525,763 people shows no correlation between the proportion of U.S. Virgin Islanders and percentage of population currently married in the United States with a correlation coefficient (R) of 0.048 and weighted average of 40.7%. Similarly, the statistical analysis conducted on geographies consisting of 585,180,453 people shows a moderate positive correlation between the proportion of Nonimmigrants and percentage of population currently married in the United States with a correlation coefficient (R) of 0.444 and weighted average of 46.9%, a difference of 15.3%.
Currently Married Correlation Summary
| Measurement | U.S. Virgin Islander | Nonimmigrants |
| Minimum | 10.7% | 24.5% |
| Maximum | 69.6% | 56.2% |
| Range | 58.9% | 31.7% |
| Mean | 41.5% | 45.3% |
| Median | 41.7% | 46.3% |
| Interquartile 25% (IQ1) | 37.2% | 43.8% |
| Interquartile 75% (IQ3) | 46.2% | 47.5% |
| Interquartile Range (IQR) | 9.0% | 3.7% |
| Standard Deviation (Sample) | 9.8% | 4.0% |
| Standard Deviation (Population) | 9.7% | 4.0% |
Similar Demographics by Currently Married
Demographics Similar to U.S. Virgin Islanders by Currently Married
In terms of currently married, the demographic groups most similar to U.S. Virgin Islanders are Immigrants from Senegal (40.7%, a difference of 0.050%), Immigrants from West Indies (40.7%, a difference of 0.060%), Barbadian (40.6%, a difference of 0.14%), Senegalese (40.6%, a difference of 0.31%), and Arapaho (40.5%, a difference of 0.35%).
| Demographics | Rating | Rank | Currently Married |
| Bahamians | 0.0 /100 | #318 | Tragic 41.2% |
| Immigrants | Somalia | 0.0 /100 | #319 | Tragic 41.2% |
| Immigrants | Jamaica | 0.0 /100 | #320 | Tragic 41.1% |
| Immigrants | Congo | 0.0 /100 | #321 | Tragic 41.1% |
| Immigrants | Haiti | 0.0 /100 | #322 | Tragic 41.0% |
| Immigrants | West Indies | 0.0 /100 | #323 | Tragic 40.7% |
| Immigrants | Senegal | 0.0 /100 | #324 | Tragic 40.7% |
| U.S. Virgin Islanders | 0.0 /100 | #325 | Tragic 40.7% |
| Barbadians | 0.0 /100 | #326 | Tragic 40.6% |
| Senegalese | 0.0 /100 | #327 | Tragic 40.6% |
| Arapaho | 0.0 /100 | #328 | Tragic 40.5% |
| Crow | 0.0 /100 | #329 | Tragic 40.4% |
| Immigrants | Dominica | 0.0 /100 | #330 | Tragic 40.3% |
| Immigrants | Barbados | 0.0 /100 | #331 | Tragic 40.3% |
| Immigrants | St. Vincent and the Grenadines | 0.0 /100 | #332 | Tragic 40.1% |
Demographics Similar to Nonimmigrants by Currently Married
In terms of currently married, the demographic groups most similar to Nonimmigrants are Immigrants from Uzbekistan (46.9%, a difference of 0.020%), Immigrants from Southern Europe (46.9%, a difference of 0.020%), Delaware (46.9%, a difference of 0.030%), Iraqi (46.9%, a difference of 0.040%), and Immigrants from Western Asia (46.9%, a difference of 0.050%).
| Demographics | Rating | Rank | Currently Married |
| Arabs | 68.6 /100 | #155 | Good 47.0% |
| Spanish | 68.1 /100 | #156 | Good 47.0% |
| Immigrants | Switzerland | 67.8 /100 | #157 | Good 46.9% |
| Cherokee | 66.8 /100 | #158 | Good 46.9% |
| Iraqis | 66.4 /100 | #159 | Good 46.9% |
| Immigrants | Uzbekistan | 66.0 /100 | #160 | Good 46.9% |
| Immigrants | Southern Europe | 65.9 /100 | #161 | Good 46.9% |
| Immigrants | Nonimmigrants | 65.4 /100 | #162 | Good 46.9% |
| Delaware | 64.7 /100 | #163 | Good 46.9% |
| Immigrants | Western Asia | 64.2 /100 | #164 | Good 46.9% |
| Samoans | 59.8 /100 | #165 | Average 46.8% |
| Immigrants | Syria | 59.3 /100 | #166 | Average 46.8% |
| Spaniards | 58.8 /100 | #167 | Average 46.8% |
| Immigrants | Afghanistan | 58.2 /100 | #168 | Average 46.8% |
| Armenians | 58.2 /100 | #169 | Average 46.8% |