Filipino vs Macedonian Currently Married
COMPARE
Filipino
Macedonian
Currently Married
Currently Married Comparison
Filipinos
Macedonians
49.7%
CURRENTLY MARRIED
99.9/ 100
METRIC RATING
10th/ 347
METRIC RANK
48.3%
CURRENTLY MARRIED
97.9/ 100
METRIC RATING
71st/ 347
METRIC RANK
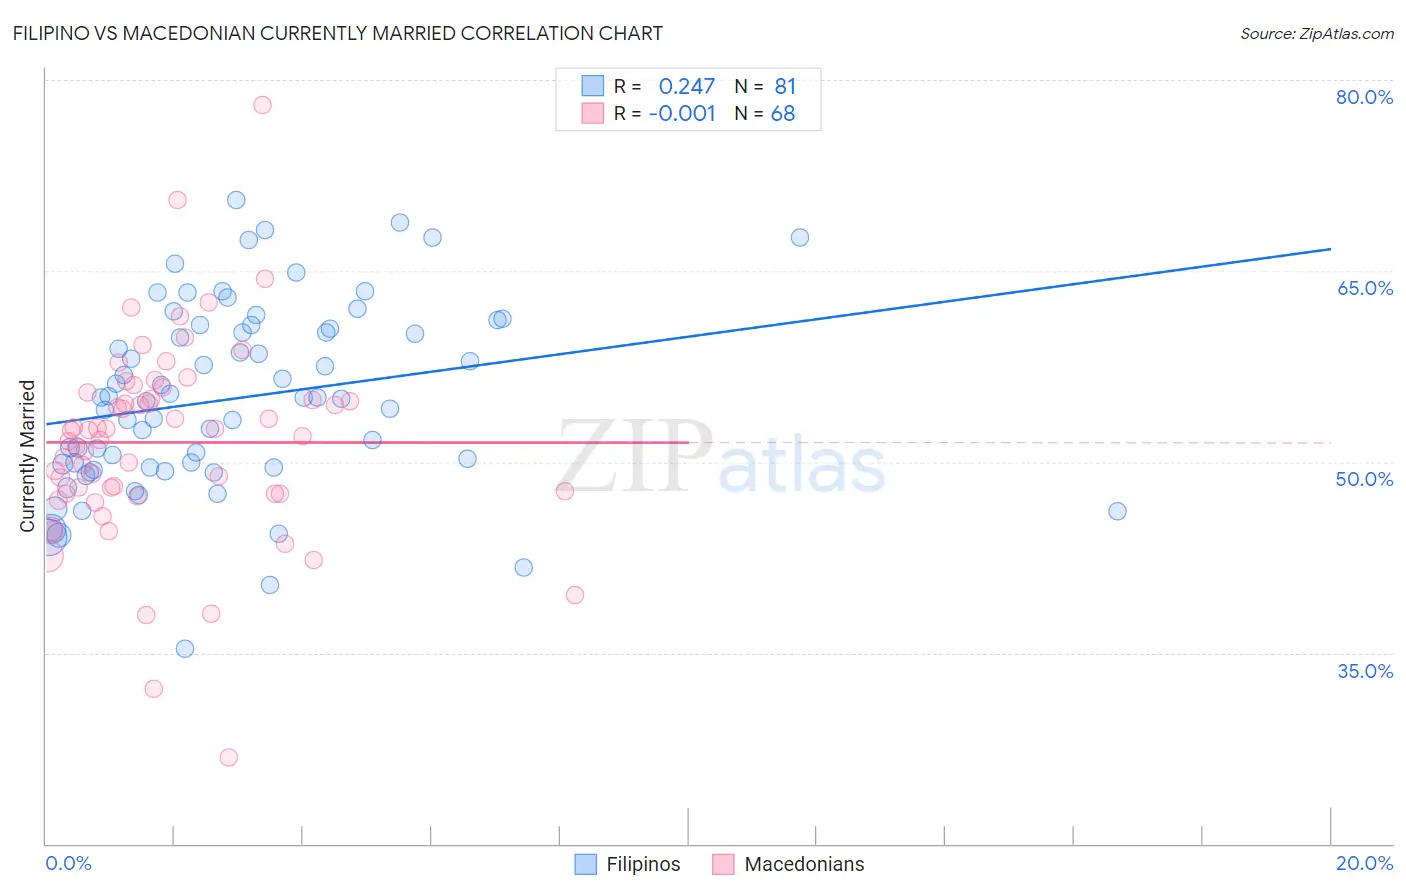
Filipino vs Macedonian Currently Married Correlation Chart
The statistical analysis conducted on geographies consisting of 254,318,851 people shows a weak positive correlation between the proportion of Filipinos and percentage of population currently married in the United States with a correlation coefficient (R) of 0.247 and weighted average of 49.7%. Similarly, the statistical analysis conducted on geographies consisting of 132,654,492 people shows no correlation between the proportion of Macedonians and percentage of population currently married in the United States with a correlation coefficient (R) of -0.001 and weighted average of 48.3%, a difference of 3.0%.
Currently Married Correlation Summary
| Measurement | Filipino | Macedonian |
| Minimum | 35.4% | 26.8% |
| Maximum | 70.6% | 78.0% |
| Range | 35.2% | 51.2% |
| Mean | 55.0% | 51.5% |
| Median | 55.0% | 52.3% |
| Interquartile 25% (IQ1) | 49.6% | 47.5% |
| Interquartile 75% (IQ3) | 60.6% | 55.2% |
| Interquartile Range (IQR) | 11.0% | 7.7% |
| Standard Deviation (Sample) | 7.3% | 7.9% |
| Standard Deviation (Population) | 7.2% | 7.8% |
Similar Demographics by Currently Married
Demographics Similar to Filipinos by Currently Married
In terms of currently married, the demographic groups most similar to Filipinos are English (49.7%, a difference of 0.010%), Swiss (49.7%, a difference of 0.020%), Czech (49.9%, a difference of 0.26%), Dutch (49.6%, a difference of 0.28%), and German (49.6%, a difference of 0.29%).
| Demographics | Rating | Rank | Currently Married |
| Assyrians/Chaldeans/Syriacs | 100.0 /100 | #3 | Exceptional 50.8% |
| Immigrants | Taiwan | 100.0 /100 | #4 | Exceptional 50.7% |
| Danes | 100.0 /100 | #5 | Exceptional 50.5% |
| Norwegians | 100.0 /100 | #6 | Exceptional 50.2% |
| Immigrants | South Central Asia | 100.0 /100 | #7 | Exceptional 50.0% |
| Swedes | 100.0 /100 | #8 | Exceptional 50.0% |
| Czechs | 99.9 /100 | #9 | Exceptional 49.9% |
| Filipinos | 99.9 /100 | #10 | Exceptional 49.7% |
| English | 99.9 /100 | #11 | Exceptional 49.7% |
| Swiss | 99.9 /100 | #12 | Exceptional 49.7% |
| Dutch | 99.9 /100 | #13 | Exceptional 49.6% |
| Germans | 99.9 /100 | #14 | Exceptional 49.6% |
| Pennsylvania Germans | 99.9 /100 | #15 | Exceptional 49.6% |
| Chinese | 99.9 /100 | #16 | Exceptional 49.5% |
| Scandinavians | 99.9 /100 | #17 | Exceptional 49.5% |
Demographics Similar to Macedonians by Currently Married
In terms of currently married, the demographic groups most similar to Macedonians are Immigrants from Asia (48.3%, a difference of 0.010%), Canadian (48.3%, a difference of 0.090%), Immigrants from England (48.3%, a difference of 0.11%), Slovak (48.3%, a difference of 0.12%), and Tongan (48.3%, a difference of 0.13%).
| Demographics | Rating | Rank | Currently Married |
| Immigrants | Czechoslovakia | 98.3 /100 | #64 | Exceptional 48.4% |
| Ukrainians | 98.3 /100 | #65 | Exceptional 48.4% |
| Tongans | 98.2 /100 | #66 | Exceptional 48.3% |
| Slovaks | 98.2 /100 | #67 | Exceptional 48.3% |
| Immigrants | England | 98.2 /100 | #68 | Exceptional 48.3% |
| Canadians | 98.1 /100 | #69 | Exceptional 48.3% |
| Immigrants | Asia | 97.9 /100 | #70 | Exceptional 48.3% |
| Macedonians | 97.9 /100 | #71 | Exceptional 48.3% |
| Immigrants | Lebanon | 97.6 /100 | #72 | Exceptional 48.2% |
| Immigrants | Eastern Asia | 97.5 /100 | #73 | Exceptional 48.2% |
| Estonians | 97.4 /100 | #74 | Exceptional 48.2% |
| Immigrants | Belarus | 97.2 /100 | #75 | Exceptional 48.1% |
| Basques | 97.2 /100 | #76 | Exceptional 48.1% |
| Slovenes | 97.1 /100 | #77 | Exceptional 48.1% |
| Immigrants | Belgium | 97.1 /100 | #78 | Exceptional 48.1% |