Immigrants from Thailand vs Macedonian Currently Married
COMPARE
Immigrants from Thailand
Macedonian
Currently Married
Currently Married Comparison
Immigrants from Thailand
Macedonians
45.4%
CURRENTLY MARRIED
5.1/ 100
METRIC RATING
217th/ 347
METRIC RANK
48.3%
CURRENTLY MARRIED
97.9/ 100
METRIC RATING
71st/ 347
METRIC RANK
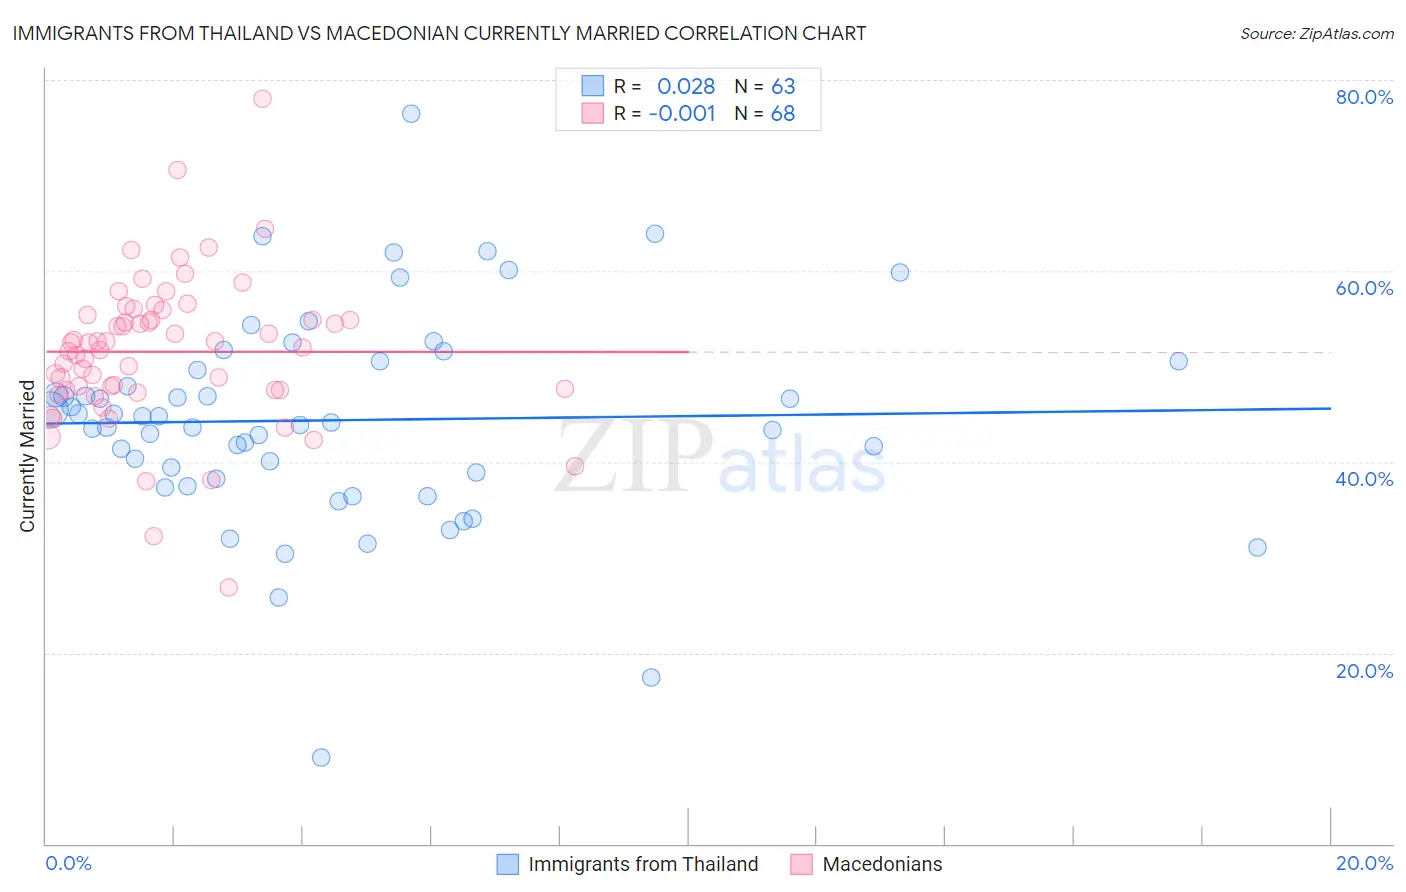
Immigrants from Thailand vs Macedonian Currently Married Correlation Chart
The statistical analysis conducted on geographies consisting of 316,997,410 people shows no correlation between the proportion of Immigrants from Thailand and percentage of population currently married in the United States with a correlation coefficient (R) of 0.028 and weighted average of 45.4%. Similarly, the statistical analysis conducted on geographies consisting of 132,654,492 people shows no correlation between the proportion of Macedonians and percentage of population currently married in the United States with a correlation coefficient (R) of -0.001 and weighted average of 48.3%, a difference of 6.4%.
Currently Married Correlation Summary
| Measurement | Immigrants from Thailand | Macedonian |
| Minimum | 9.0% | 26.8% |
| Maximum | 76.5% | 78.0% |
| Range | 67.5% | 51.2% |
| Mean | 44.4% | 51.5% |
| Median | 44.1% | 52.3% |
| Interquartile 25% (IQ1) | 38.3% | 47.5% |
| Interquartile 75% (IQ3) | 50.6% | 55.2% |
| Interquartile Range (IQR) | 12.3% | 7.7% |
| Standard Deviation (Sample) | 11.0% | 7.9% |
| Standard Deviation (Population) | 11.0% | 7.8% |
Similar Demographics by Currently Married
Demographics Similar to Immigrants from Thailand by Currently Married
In terms of currently married, the demographic groups most similar to Immigrants from Thailand are Immigrants from Morocco (45.4%, a difference of 0.080%), Panamanian (45.3%, a difference of 0.24%), Dutch West Indian (45.5%, a difference of 0.28%), German Russian (45.5%, a difference of 0.28%), and Alaska Native (45.5%, a difference of 0.32%).
| Demographics | Rating | Rank | Currently Married |
| Uruguayans | 7.9 /100 | #210 | Tragic 45.6% |
| Houma | 7.2 /100 | #211 | Tragic 45.5% |
| Marshallese | 7.2 /100 | #212 | Tragic 45.5% |
| Alaska Natives | 7.0 /100 | #213 | Tragic 45.5% |
| Dutch West Indians | 6.7 /100 | #214 | Tragic 45.5% |
| German Russians | 6.7 /100 | #215 | Tragic 45.5% |
| Immigrants | Morocco | 5.5 /100 | #216 | Tragic 45.4% |
| Immigrants | Thailand | 5.1 /100 | #217 | Tragic 45.4% |
| Panamanians | 4.0 /100 | #218 | Tragic 45.3% |
| Immigrants | Portugal | 3.5 /100 | #219 | Tragic 45.2% |
| Kenyans | 3.1 /100 | #220 | Tragic 45.2% |
| Mexicans | 3.0 /100 | #221 | Tragic 45.2% |
| Immigrants | Azores | 2.5 /100 | #222 | Tragic 45.1% |
| Immigrants | Laos | 2.3 /100 | #223 | Tragic 45.0% |
| Immigrants | Uganda | 2.2 /100 | #224 | Tragic 45.0% |
Demographics Similar to Macedonians by Currently Married
In terms of currently married, the demographic groups most similar to Macedonians are Immigrants from Asia (48.3%, a difference of 0.010%), Canadian (48.3%, a difference of 0.090%), Immigrants from England (48.3%, a difference of 0.11%), Slovak (48.3%, a difference of 0.12%), and Tongan (48.3%, a difference of 0.13%).
| Demographics | Rating | Rank | Currently Married |
| Immigrants | Czechoslovakia | 98.3 /100 | #64 | Exceptional 48.4% |
| Ukrainians | 98.3 /100 | #65 | Exceptional 48.4% |
| Tongans | 98.2 /100 | #66 | Exceptional 48.3% |
| Slovaks | 98.2 /100 | #67 | Exceptional 48.3% |
| Immigrants | England | 98.2 /100 | #68 | Exceptional 48.3% |
| Canadians | 98.1 /100 | #69 | Exceptional 48.3% |
| Immigrants | Asia | 97.9 /100 | #70 | Exceptional 48.3% |
| Macedonians | 97.9 /100 | #71 | Exceptional 48.3% |
| Immigrants | Lebanon | 97.6 /100 | #72 | Exceptional 48.2% |
| Immigrants | Eastern Asia | 97.5 /100 | #73 | Exceptional 48.2% |
| Estonians | 97.4 /100 | #74 | Exceptional 48.2% |
| Immigrants | Belarus | 97.2 /100 | #75 | Exceptional 48.1% |
| Basques | 97.2 /100 | #76 | Exceptional 48.1% |
| Slovenes | 97.1 /100 | #77 | Exceptional 48.1% |
| Immigrants | Belgium | 97.1 /100 | #78 | Exceptional 48.1% |