Salvadoran vs Immigrants from Argentina Divorced or Separated
COMPARE
Salvadoran
Immigrants from Argentina
Divorced or Separated
Divorced or Separated Comparison
Salvadorans
Immigrants from Argentina
11.6%
DIVORCED OR SEPARATED
98.2/ 100
METRIC RATING
104th/ 347
METRIC RANK
12.2%
DIVORCED OR SEPARATED
15.5/ 100
METRIC RATING
214th/ 347
METRIC RANK
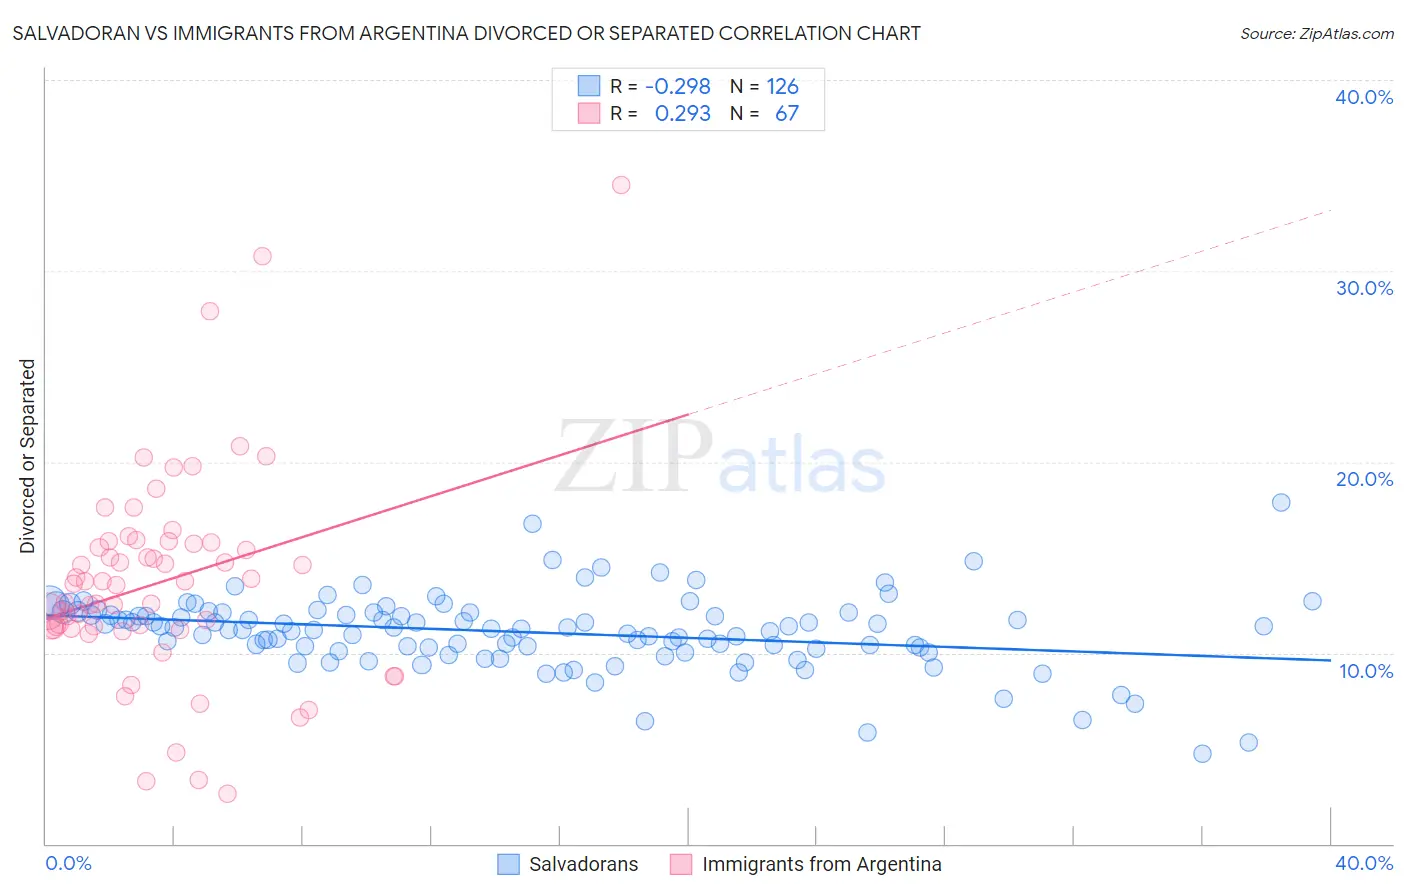
Salvadoran vs Immigrants from Argentina Divorced or Separated Correlation Chart
The statistical analysis conducted on geographies consisting of 398,863,882 people shows a weak negative correlation between the proportion of Salvadorans and percentage of population currently divorced or separated in the United States with a correlation coefficient (R) of -0.298 and weighted average of 11.6%. Similarly, the statistical analysis conducted on geographies consisting of 264,380,212 people shows a weak positive correlation between the proportion of Immigrants from Argentina and percentage of population currently divorced or separated in the United States with a correlation coefficient (R) of 0.293 and weighted average of 12.2%, a difference of 5.1%.
Divorced or Separated Correlation Summary
| Measurement | Salvadoran | Immigrants from Argentina |
| Minimum | 4.7% | 2.6% |
| Maximum | 17.9% | 34.5% |
| Range | 13.2% | 31.9% |
| Mean | 11.1% | 13.7% |
| Median | 11.3% | 13.6% |
| Interquartile 25% (IQ1) | 10.3% | 11.3% |
| Interquartile 75% (IQ3) | 12.1% | 15.8% |
| Interquartile Range (IQR) | 1.8% | 4.5% |
| Standard Deviation (Sample) | 1.9% | 5.5% |
| Standard Deviation (Population) | 1.9% | 5.5% |
Similar Demographics by Divorced or Separated
Demographics Similar to Salvadorans by Divorced or Separated
In terms of divorced or separated, the demographic groups most similar to Salvadorans are Maltese (11.6%, a difference of 0.020%), Immigrants from Croatia (11.6%, a difference of 0.050%), Immigrants from El Salvador (11.7%, a difference of 0.12%), Immigrants from Kazakhstan (11.7%, a difference of 0.16%), and Immigrants from Guyana (11.6%, a difference of 0.19%).
| Demographics | Rating | Rank | Divorced or Separated |
| Latvians | 98.7 /100 | #97 | Exceptional 11.6% |
| Immigrants | Jordan | 98.6 /100 | #98 | Exceptional 11.6% |
| Immigrants | Sweden | 98.6 /100 | #99 | Exceptional 11.6% |
| Immigrants | Northern Europe | 98.6 /100 | #100 | Exceptional 11.6% |
| Immigrants | Guyana | 98.5 /100 | #101 | Exceptional 11.6% |
| Immigrants | Croatia | 98.3 /100 | #102 | Exceptional 11.6% |
| Maltese | 98.2 /100 | #103 | Exceptional 11.6% |
| Salvadorans | 98.2 /100 | #104 | Exceptional 11.6% |
| Immigrants | El Salvador | 97.9 /100 | #105 | Exceptional 11.7% |
| Immigrants | Kazakhstan | 97.8 /100 | #106 | Exceptional 11.7% |
| Native Hawaiians | 97.2 /100 | #107 | Exceptional 11.7% |
| Greeks | 96.9 /100 | #108 | Exceptional 11.7% |
| Immigrants | South Africa | 96.9 /100 | #109 | Exceptional 11.7% |
| Immigrants | Czechoslovakia | 96.9 /100 | #110 | Exceptional 11.7% |
| Immigrants | Spain | 96.8 /100 | #111 | Exceptional 11.7% |
Demographics Similar to Immigrants from Argentina by Divorced or Separated
In terms of divorced or separated, the demographic groups most similar to Immigrants from Argentina are European (12.2%, a difference of 0.010%), Immigrants from South America (12.2%, a difference of 0.010%), Immigrants from Eastern Africa (12.2%, a difference of 0.050%), Northern European (12.2%, a difference of 0.050%), and Immigrants from Kenya (12.2%, a difference of 0.060%).
| Demographics | Rating | Rank | Divorced or Separated |
| Mexicans | 21.0 /100 | #207 | Fair 12.2% |
| Immigrants | Ghana | 18.8 /100 | #208 | Poor 12.2% |
| Immigrants | Trinidad and Tobago | 17.8 /100 | #209 | Poor 12.2% |
| Slavs | 17.0 /100 | #210 | Poor 12.2% |
| Trinidadians and Tobagonians | 16.6 /100 | #211 | Poor 12.2% |
| Immigrants | Kenya | 16.5 /100 | #212 | Poor 12.2% |
| Immigrants | Eastern Africa | 16.2 /100 | #213 | Poor 12.2% |
| Immigrants | Argentina | 15.5 /100 | #214 | Poor 12.2% |
| Europeans | 15.4 /100 | #215 | Poor 12.2% |
| Immigrants | South America | 15.4 /100 | #216 | Poor 12.2% |
| Northern Europeans | 14.7 /100 | #217 | Poor 12.2% |
| Slovenes | 13.2 /100 | #218 | Poor 12.3% |
| Czechoslovakians | 11.7 /100 | #219 | Poor 12.3% |
| British | 11.6 /100 | #220 | Poor 12.3% |
| Guamanians/Chamorros | 11.3 /100 | #221 | Poor 12.3% |