Salvadoran vs Chinese Divorced or Separated
COMPARE
Salvadoran
Chinese
Divorced or Separated
Divorced or Separated Comparison
Salvadorans
Chinese
11.6%
DIVORCED OR SEPARATED
98.2/ 100
METRIC RATING
104th/ 347
METRIC RANK
11.2%
DIVORCED OR SEPARATED
100.0/ 100
METRIC RATING
42nd/ 347
METRIC RANK
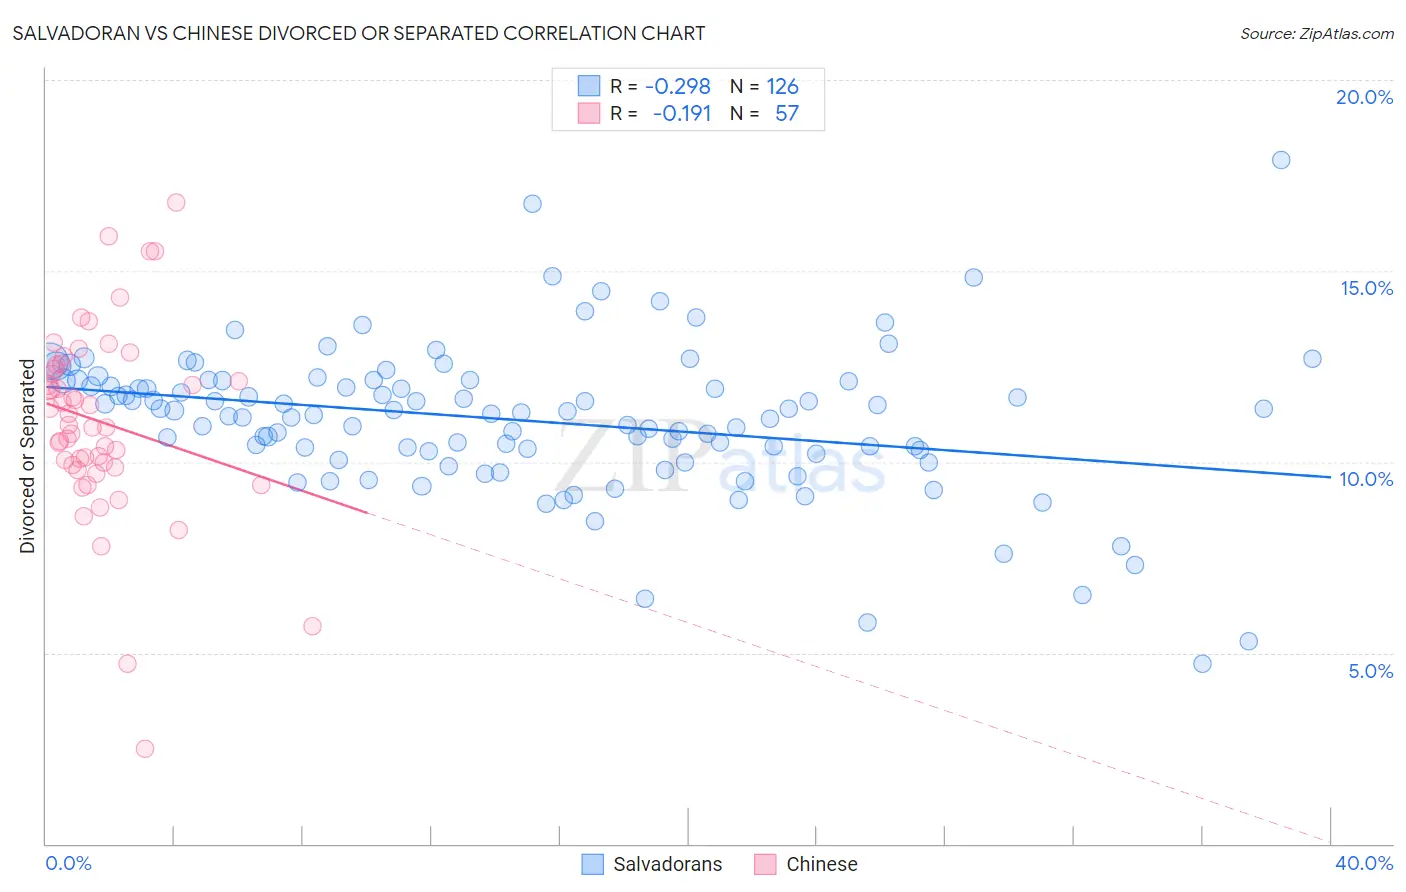
Salvadoran vs Chinese Divorced or Separated Correlation Chart
The statistical analysis conducted on geographies consisting of 398,863,882 people shows a weak negative correlation between the proportion of Salvadorans and percentage of population currently divorced or separated in the United States with a correlation coefficient (R) of -0.298 and weighted average of 11.6%. Similarly, the statistical analysis conducted on geographies consisting of 64,808,439 people shows a poor negative correlation between the proportion of Chinese and percentage of population currently divorced or separated in the United States with a correlation coefficient (R) of -0.191 and weighted average of 11.2%, a difference of 4.1%.
Divorced or Separated Correlation Summary
| Measurement | Salvadoran | Chinese |
| Minimum | 4.7% | 2.5% |
| Maximum | 17.9% | 16.8% |
| Range | 13.2% | 14.3% |
| Mean | 11.1% | 11.1% |
| Median | 11.3% | 11.0% |
| Interquartile 25% (IQ1) | 10.3% | 9.9% |
| Interquartile 75% (IQ3) | 12.1% | 12.5% |
| Interquartile Range (IQR) | 1.8% | 2.6% |
| Standard Deviation (Sample) | 1.9% | 2.5% |
| Standard Deviation (Population) | 1.9% | 2.5% |
Similar Demographics by Divorced or Separated
Demographics Similar to Salvadorans by Divorced or Separated
In terms of divorced or separated, the demographic groups most similar to Salvadorans are Maltese (11.6%, a difference of 0.020%), Immigrants from Croatia (11.6%, a difference of 0.050%), Immigrants from El Salvador (11.7%, a difference of 0.12%), Immigrants from Kazakhstan (11.7%, a difference of 0.16%), and Immigrants from Guyana (11.6%, a difference of 0.19%).
| Demographics | Rating | Rank | Divorced or Separated |
| Latvians | 98.7 /100 | #97 | Exceptional 11.6% |
| Immigrants | Jordan | 98.6 /100 | #98 | Exceptional 11.6% |
| Immigrants | Sweden | 98.6 /100 | #99 | Exceptional 11.6% |
| Immigrants | Northern Europe | 98.6 /100 | #100 | Exceptional 11.6% |
| Immigrants | Guyana | 98.5 /100 | #101 | Exceptional 11.6% |
| Immigrants | Croatia | 98.3 /100 | #102 | Exceptional 11.6% |
| Maltese | 98.2 /100 | #103 | Exceptional 11.6% |
| Salvadorans | 98.2 /100 | #104 | Exceptional 11.6% |
| Immigrants | El Salvador | 97.9 /100 | #105 | Exceptional 11.7% |
| Immigrants | Kazakhstan | 97.8 /100 | #106 | Exceptional 11.7% |
| Native Hawaiians | 97.2 /100 | #107 | Exceptional 11.7% |
| Greeks | 96.9 /100 | #108 | Exceptional 11.7% |
| Immigrants | South Africa | 96.9 /100 | #109 | Exceptional 11.7% |
| Immigrants | Czechoslovakia | 96.9 /100 | #110 | Exceptional 11.7% |
| Immigrants | Spain | 96.8 /100 | #111 | Exceptional 11.7% |
Demographics Similar to Chinese by Divorced or Separated
In terms of divorced or separated, the demographic groups most similar to Chinese are Immigrants from Belarus (11.2%, a difference of 0.010%), Immigrants from Western Asia (11.2%, a difference of 0.020%), Bhutanese (11.2%, a difference of 0.060%), Turkish (11.2%, a difference of 0.070%), and Laotian (11.2%, a difference of 0.18%).
| Demographics | Rating | Rank | Divorced or Separated |
| Cambodians | 100.0 /100 | #35 | Exceptional 11.1% |
| Immigrants | Japan | 100.0 /100 | #36 | Exceptional 11.1% |
| Immigrants | Lebanon | 100.0 /100 | #37 | Exceptional 11.1% |
| Immigrants | Greece | 100.0 /100 | #38 | Exceptional 11.1% |
| Immigrants | Egypt | 100.0 /100 | #39 | Exceptional 11.1% |
| Soviet Union | 100.0 /100 | #40 | Exceptional 11.1% |
| Bhutanese | 100.0 /100 | #41 | Exceptional 11.2% |
| Chinese | 100.0 /100 | #42 | Exceptional 11.2% |
| Immigrants | Belarus | 100.0 /100 | #43 | Exceptional 11.2% |
| Immigrants | Western Asia | 100.0 /100 | #44 | Exceptional 11.2% |
| Turks | 100.0 /100 | #45 | Exceptional 11.2% |
| Laotians | 100.0 /100 | #46 | Exceptional 11.2% |
| Immigrants | Poland | 100.0 /100 | #47 | Exceptional 11.2% |
| Immigrants | Turkey | 100.0 /100 | #48 | Exceptional 11.2% |
| Immigrants | Saudi Arabia | 100.0 /100 | #49 | Exceptional 11.2% |