Immigrants from Congo vs Immigrants from Eritrea Divorced or Separated
COMPARE
Immigrants from Congo
Immigrants from Eritrea
Divorced or Separated
Divorced or Separated Comparison
Immigrants from Congo
Immigrants from Eritrea
13.5%
DIVORCED OR SEPARATED
0.0/ 100
METRIC RATING
326th/ 347
METRIC RANK
12.1%
DIVORCED OR SEPARATED
31.9/ 100
METRIC RATING
194th/ 347
METRIC RANK
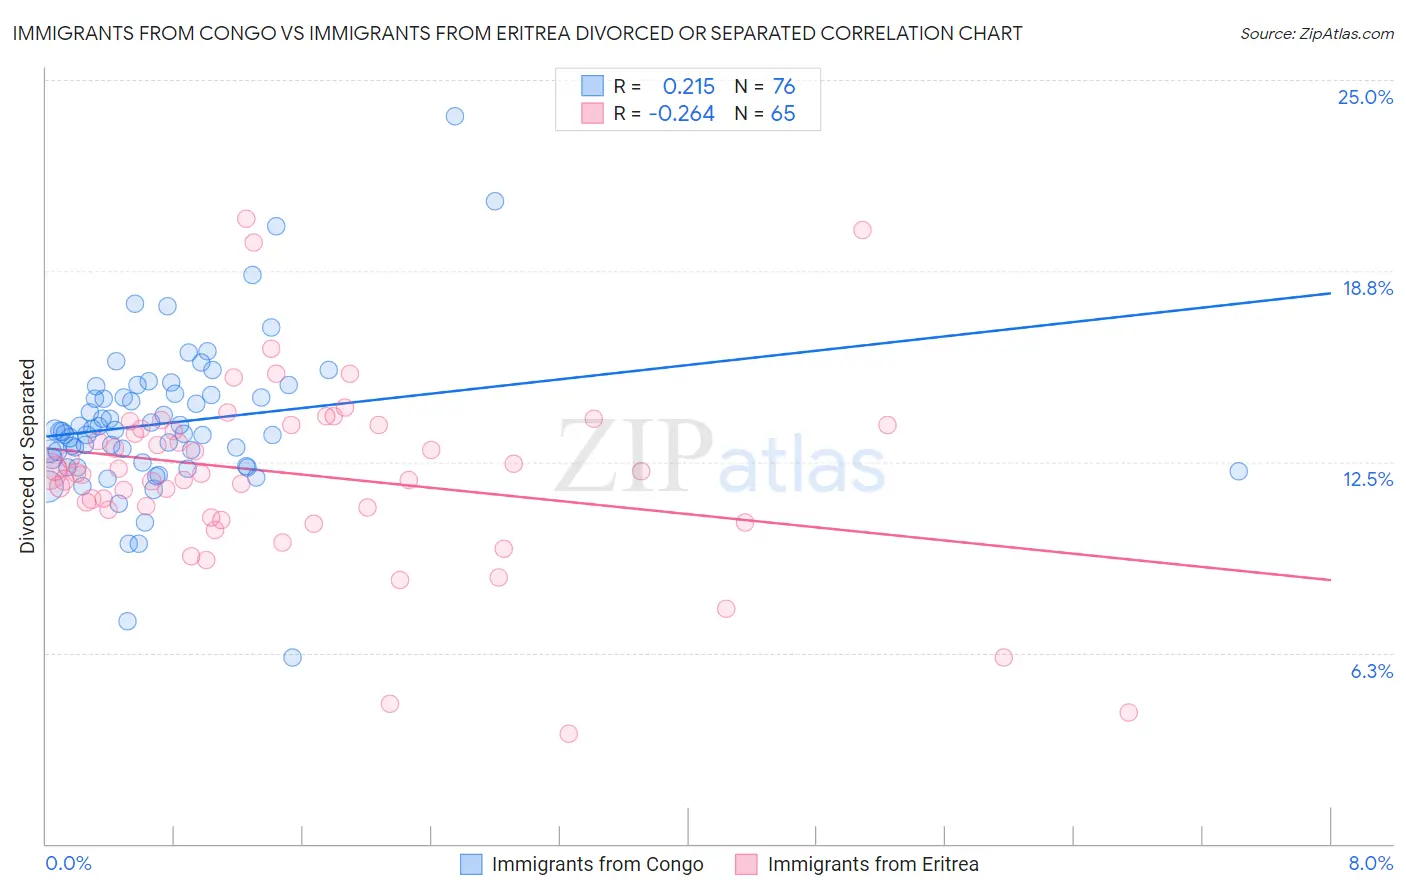
Immigrants from Congo vs Immigrants from Eritrea Divorced or Separated Correlation Chart
The statistical analysis conducted on geographies consisting of 92,097,616 people shows a weak positive correlation between the proportion of Immigrants from Congo and percentage of population currently divorced or separated in the United States with a correlation coefficient (R) of 0.215 and weighted average of 13.5%. Similarly, the statistical analysis conducted on geographies consisting of 104,847,630 people shows a weak negative correlation between the proportion of Immigrants from Eritrea and percentage of population currently divorced or separated in the United States with a correlation coefficient (R) of -0.264 and weighted average of 12.1%, a difference of 10.9%.
Divorced or Separated Correlation Summary
| Measurement | Immigrants from Congo | Immigrants from Eritrea |
| Minimum | 6.1% | 3.6% |
| Maximum | 23.8% | 20.5% |
| Range | 17.7% | 16.9% |
| Mean | 13.8% | 12.1% |
| Median | 13.5% | 12.2% |
| Interquartile 25% (IQ1) | 12.4% | 10.8% |
| Interquartile 75% (IQ3) | 14.7% | 13.7% |
| Interquartile Range (IQR) | 2.3% | 2.9% |
| Standard Deviation (Sample) | 2.6% | 3.1% |
| Standard Deviation (Population) | 2.6% | 3.0% |
Similar Demographics by Divorced or Separated
Demographics Similar to Immigrants from Congo by Divorced or Separated
In terms of divorced or separated, the demographic groups most similar to Immigrants from Congo are Potawatomi (13.5%, a difference of 0.010%), Osage (13.4%, a difference of 0.070%), U.S. Virgin Islander (13.4%, a difference of 0.14%), Immigrants from Haiti (13.4%, a difference of 0.36%), and Comanche (13.5%, a difference of 0.48%).
| Demographics | Rating | Rank | Divorced or Separated |
| Puget Sound Salish | 0.0 /100 | #319 | Tragic 13.4% |
| Cajuns | 0.0 /100 | #320 | Tragic 13.4% |
| Cheyenne | 0.0 /100 | #321 | Tragic 13.4% |
| Immigrants | Haiti | 0.0 /100 | #322 | Tragic 13.4% |
| U.S. Virgin Islanders | 0.0 /100 | #323 | Tragic 13.4% |
| Osage | 0.0 /100 | #324 | Tragic 13.4% |
| Potawatomi | 0.0 /100 | #325 | Tragic 13.5% |
| Immigrants | Congo | 0.0 /100 | #326 | Tragic 13.5% |
| Comanche | 0.0 /100 | #327 | Tragic 13.5% |
| Immigrants | Caribbean | 0.0 /100 | #328 | Tragic 13.6% |
| Houma | 0.0 /100 | #329 | Tragic 13.6% |
| Paiute | 0.0 /100 | #330 | Tragic 13.6% |
| Blacks/African Americans | 0.0 /100 | #331 | Tragic 13.6% |
| Cherokee | 0.0 /100 | #332 | Tragic 13.7% |
| Puerto Ricans | 0.0 /100 | #333 | Tragic 13.9% |
Demographics Similar to Immigrants from Eritrea by Divorced or Separated
In terms of divorced or separated, the demographic groups most similar to Immigrants from Eritrea are Immigrants from Thailand (12.1%, a difference of 0.020%), Immigrants from England (12.1%, a difference of 0.020%), Norwegian (12.1%, a difference of 0.050%), Immigrants from Burma/Myanmar (12.1%, a difference of 0.060%), and Immigrants from Africa (12.1%, a difference of 0.060%).
| Demographics | Rating | Rank | Divorced or Separated |
| Belizeans | 37.7 /100 | #187 | Fair 12.1% |
| Immigrants | Belize | 37.6 /100 | #188 | Fair 12.1% |
| Sierra Leoneans | 35.5 /100 | #189 | Fair 12.1% |
| Moroccans | 34.8 /100 | #190 | Fair 12.1% |
| Swedes | 34.4 /100 | #191 | Fair 12.1% |
| Norwegians | 33.2 /100 | #192 | Fair 12.1% |
| Immigrants | Thailand | 32.5 /100 | #193 | Fair 12.1% |
| Immigrants | Eritrea | 31.9 /100 | #194 | Fair 12.1% |
| Immigrants | England | 31.4 /100 | #195 | Fair 12.1% |
| Immigrants | Burma/Myanmar | 30.4 /100 | #196 | Fair 12.1% |
| Immigrants | Africa | 30.3 /100 | #197 | Fair 12.1% |
| Nigerians | 30.1 /100 | #198 | Fair 12.1% |
| Central Americans | 29.4 /100 | #199 | Fair 12.1% |
| South Americans | 28.6 /100 | #200 | Fair 12.2% |
| Guatemalans | 26.9 /100 | #201 | Fair 12.2% |