Salvadoran vs Immigrants from Netherlands Divorced or Separated
COMPARE
Salvadoran
Immigrants from Netherlands
Divorced or Separated
Divorced or Separated Comparison
Salvadorans
Immigrants from Netherlands
11.6%
DIVORCED OR SEPARATED
98.2/ 100
METRIC RATING
104th/ 347
METRIC RANK
11.9%
DIVORCED OR SEPARATED
83.9/ 100
METRIC RATING
138th/ 347
METRIC RANK
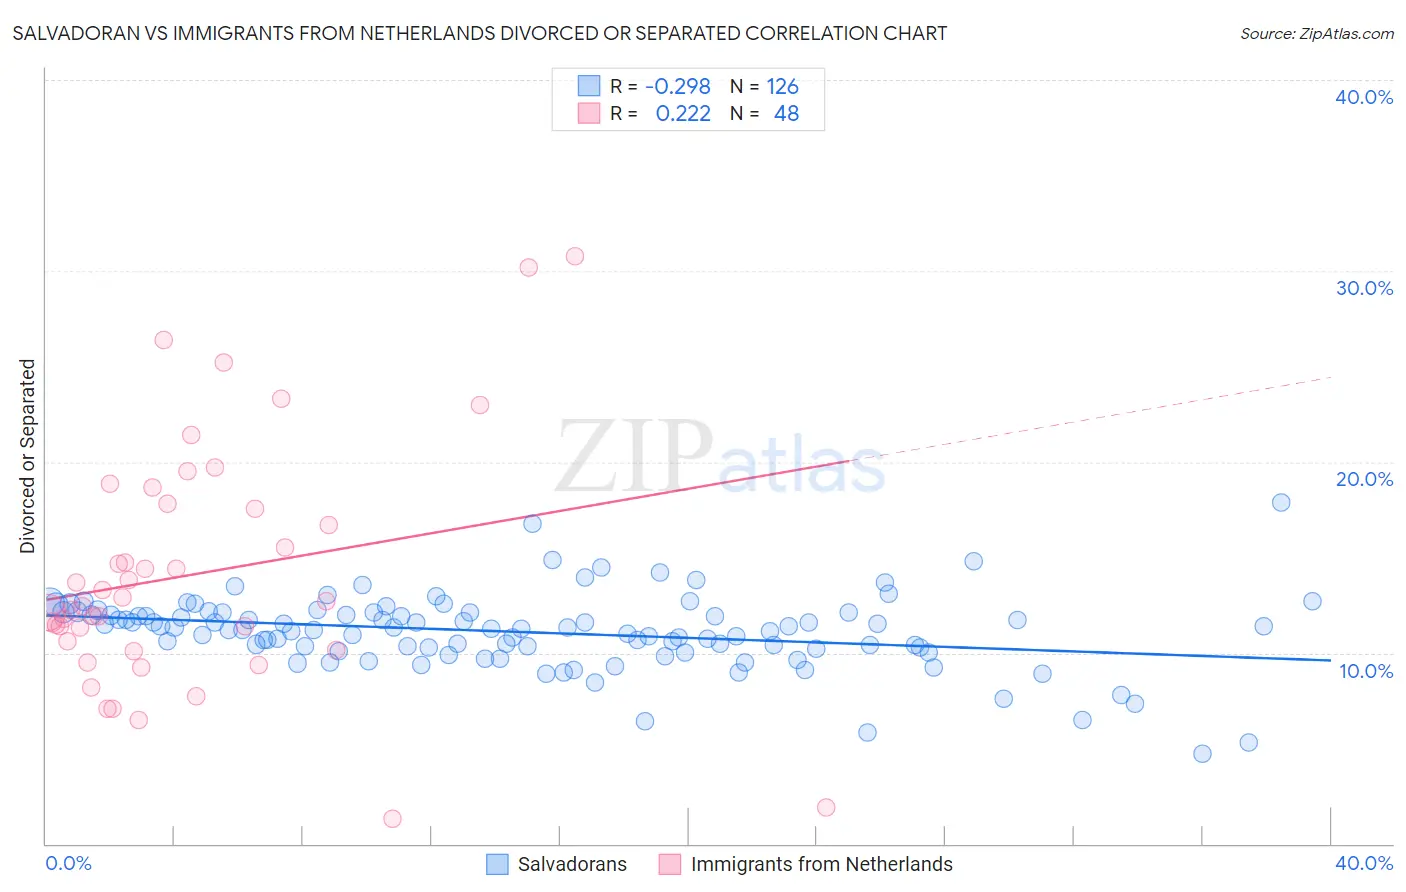
Salvadoran vs Immigrants from Netherlands Divorced or Separated Correlation Chart
The statistical analysis conducted on geographies consisting of 398,863,882 people shows a weak negative correlation between the proportion of Salvadorans and percentage of population currently divorced or separated in the United States with a correlation coefficient (R) of -0.298 and weighted average of 11.6%. Similarly, the statistical analysis conducted on geographies consisting of 237,821,691 people shows a weak positive correlation between the proportion of Immigrants from Netherlands and percentage of population currently divorced or separated in the United States with a correlation coefficient (R) of 0.222 and weighted average of 11.9%, a difference of 2.1%.
Divorced or Separated Correlation Summary
| Measurement | Salvadoran | Immigrants from Netherlands |
| Minimum | 4.7% | 1.3% |
| Maximum | 17.9% | 30.8% |
| Range | 13.2% | 29.5% |
| Mean | 11.1% | 14.1% |
| Median | 11.3% | 12.6% |
| Interquartile 25% (IQ1) | 10.3% | 10.4% |
| Interquartile 75% (IQ3) | 12.1% | 17.7% |
| Interquartile Range (IQR) | 1.8% | 7.3% |
| Standard Deviation (Sample) | 1.9% | 6.3% |
| Standard Deviation (Population) | 1.9% | 6.3% |
Similar Demographics by Divorced or Separated
Demographics Similar to Salvadorans by Divorced or Separated
In terms of divorced or separated, the demographic groups most similar to Salvadorans are Maltese (11.6%, a difference of 0.020%), Immigrants from Croatia (11.6%, a difference of 0.050%), Immigrants from El Salvador (11.7%, a difference of 0.12%), Immigrants from Kazakhstan (11.7%, a difference of 0.16%), and Immigrants from Guyana (11.6%, a difference of 0.19%).
| Demographics | Rating | Rank | Divorced or Separated |
| Latvians | 98.7 /100 | #97 | Exceptional 11.6% |
| Immigrants | Jordan | 98.6 /100 | #98 | Exceptional 11.6% |
| Immigrants | Sweden | 98.6 /100 | #99 | Exceptional 11.6% |
| Immigrants | Northern Europe | 98.6 /100 | #100 | Exceptional 11.6% |
| Immigrants | Guyana | 98.5 /100 | #101 | Exceptional 11.6% |
| Immigrants | Croatia | 98.3 /100 | #102 | Exceptional 11.6% |
| Maltese | 98.2 /100 | #103 | Exceptional 11.6% |
| Salvadorans | 98.2 /100 | #104 | Exceptional 11.6% |
| Immigrants | El Salvador | 97.9 /100 | #105 | Exceptional 11.7% |
| Immigrants | Kazakhstan | 97.8 /100 | #106 | Exceptional 11.7% |
| Native Hawaiians | 97.2 /100 | #107 | Exceptional 11.7% |
| Greeks | 96.9 /100 | #108 | Exceptional 11.7% |
| Immigrants | South Africa | 96.9 /100 | #109 | Exceptional 11.7% |
| Immigrants | Czechoslovakia | 96.9 /100 | #110 | Exceptional 11.7% |
| Immigrants | Spain | 96.8 /100 | #111 | Exceptional 11.7% |
Demographics Similar to Immigrants from Netherlands by Divorced or Separated
In terms of divorced or separated, the demographic groups most similar to Immigrants from Netherlands are Alsatian (11.9%, a difference of 0.0%), Australian (11.9%, a difference of 0.020%), Lebanese (11.9%, a difference of 0.030%), Danish (11.9%, a difference of 0.060%), and Carpatho Rusyn (11.9%, a difference of 0.060%).
| Demographics | Rating | Rank | Divorced or Separated |
| Immigrants | Cambodia | 88.2 /100 | #131 | Excellent 11.8% |
| Immigrants | Afghanistan | 87.9 /100 | #132 | Excellent 11.8% |
| New Zealanders | 87.5 /100 | #133 | Excellent 11.9% |
| Argentineans | 85.1 /100 | #134 | Excellent 11.9% |
| Danes | 84.8 /100 | #135 | Excellent 11.9% |
| Carpatho Rusyns | 84.8 /100 | #136 | Excellent 11.9% |
| Alsatians | 84.0 /100 | #137 | Excellent 11.9% |
| Immigrants | Netherlands | 83.9 /100 | #138 | Excellent 11.9% |
| Australians | 83.6 /100 | #139 | Excellent 11.9% |
| Lebanese | 83.4 /100 | #140 | Excellent 11.9% |
| Immigrants | Morocco | 82.9 /100 | #141 | Excellent 11.9% |
| Immigrants | Zimbabwe | 81.5 /100 | #142 | Excellent 11.9% |
| Pakistanis | 81.3 /100 | #143 | Excellent 11.9% |
| Peruvians | 80.9 /100 | #144 | Excellent 11.9% |
| Croatians | 80.6 /100 | #145 | Excellent 11.9% |