Immigrants from Northern Africa vs West Indian Married-couple Households
COMPARE
Immigrants from Northern Africa
West Indian
Married-couple Households
Married-couple Households Comparison
Immigrants from Northern Africa
West Indians
46.0%
MARRIED-COUPLE HOUSEHOLDS
24.6/ 100
METRIC RATING
192nd/ 347
METRIC RANK
40.3%
MARRIED-COUPLE HOUSEHOLDS
0.0/ 100
METRIC RATING
320th/ 347
METRIC RANK
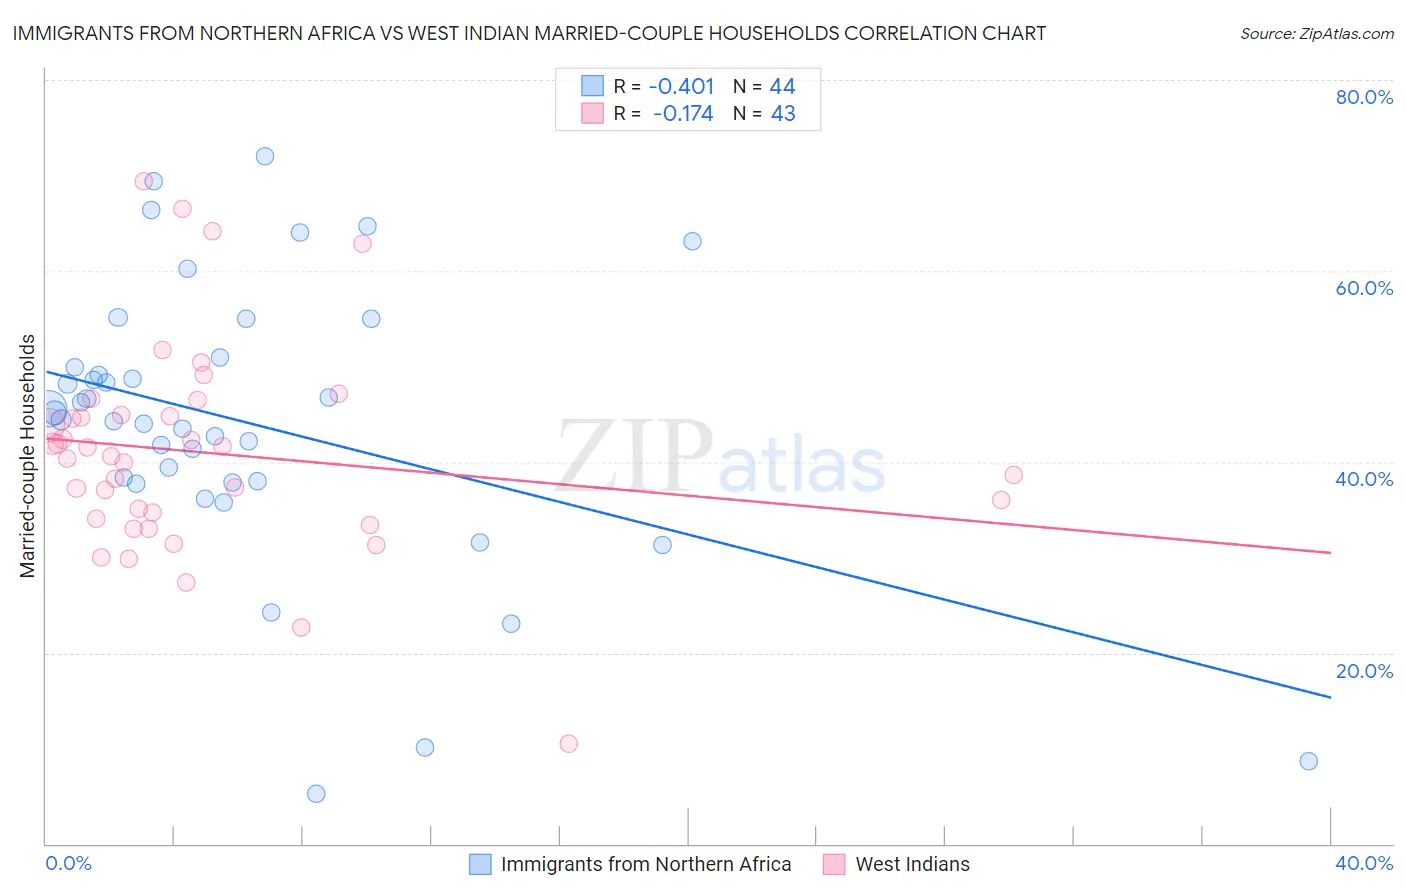
Immigrants from Northern Africa vs West Indian Married-couple Households Correlation Chart
The statistical analysis conducted on geographies consisting of 321,083,250 people shows a moderate negative correlation between the proportion of Immigrants from Northern Africa and percentage of married-couple family households in the United States with a correlation coefficient (R) of -0.401 and weighted average of 46.0%. Similarly, the statistical analysis conducted on geographies consisting of 253,854,054 people shows a poor negative correlation between the proportion of West Indians and percentage of married-couple family households in the United States with a correlation coefficient (R) of -0.174 and weighted average of 40.3%, a difference of 13.9%.
Married-couple Households Correlation Summary
| Measurement | Immigrants from Northern Africa | West Indian |
| Minimum | 5.3% | 10.5% |
| Maximum | 72.0% | 69.4% |
| Range | 66.8% | 58.9% |
| Mean | 44.1% | 40.9% |
| Median | 44.8% | 40.5% |
| Interquartile 25% (IQ1) | 37.9% | 34.0% |
| Interquartile 75% (IQ3) | 50.5% | 44.9% |
| Interquartile Range (IQR) | 12.6% | 10.8% |
| Standard Deviation (Sample) | 14.7% | 11.1% |
| Standard Deviation (Population) | 14.6% | 11.0% |
Similar Demographics by Married-couple Households
Demographics Similar to Immigrants from Northern Africa by Married-couple Households
In terms of married-couple households, the demographic groups most similar to Immigrants from Northern Africa are Choctaw (46.0%, a difference of 0.020%), Immigrants from Kuwait (46.0%, a difference of 0.050%), Taiwanese (45.9%, a difference of 0.060%), Mexican American Indian (45.9%, a difference of 0.070%), and Chickasaw (45.9%, a difference of 0.10%).
| Demographics | Rating | Rank | Married-couple Households |
| Brazilians | 35.9 /100 | #185 | Fair 46.2% |
| Albanians | 31.1 /100 | #186 | Fair 46.1% |
| Fijians | 29.2 /100 | #187 | Fair 46.1% |
| South American Indians | 28.4 /100 | #188 | Fair 46.0% |
| Immigrants | Latvia | 26.9 /100 | #189 | Fair 46.0% |
| Immigrants | Kuwait | 25.6 /100 | #190 | Fair 46.0% |
| Choctaw | 24.9 /100 | #191 | Fair 46.0% |
| Immigrants | Northern Africa | 24.6 /100 | #192 | Fair 46.0% |
| Taiwanese | 23.4 /100 | #193 | Fair 45.9% |
| Mexican American Indians | 23.3 /100 | #194 | Fair 45.9% |
| Chickasaw | 22.7 /100 | #195 | Fair 45.9% |
| Immigrants | South America | 22.2 /100 | #196 | Fair 45.9% |
| Cambodians | 21.3 /100 | #197 | Fair 45.9% |
| Ottawa | 19.4 /100 | #198 | Poor 45.8% |
| Carpatho Rusyns | 15.7 /100 | #199 | Poor 45.7% |
Demographics Similar to West Indians by Married-couple Households
In terms of married-couple households, the demographic groups most similar to West Indians are Immigrants from Liberia (40.3%, a difference of 0.040%), Bahamian (40.5%, a difference of 0.42%), Immigrants from Zaire (40.1%, a difference of 0.70%), Puerto Rican (40.1%, a difference of 0.70%), and Navajo (40.1%, a difference of 0.71%).
| Demographics | Rating | Rank | Married-couple Households |
| Immigrants | Haiti | 0.0 /100 | #313 | Tragic 40.9% |
| Jamaicans | 0.0 /100 | #314 | Tragic 40.9% |
| Trinidadians and Tobagonians | 0.0 /100 | #315 | Tragic 40.9% |
| Immigrants | Caribbean | 0.0 /100 | #316 | Tragic 40.8% |
| Immigrants | Jamaica | 0.0 /100 | #317 | Tragic 40.7% |
| Liberians | 0.0 /100 | #318 | Tragic 40.7% |
| Bahamians | 0.0 /100 | #319 | Tragic 40.5% |
| West Indians | 0.0 /100 | #320 | Tragic 40.3% |
| Immigrants | Liberia | 0.0 /100 | #321 | Tragic 40.3% |
| Immigrants | Zaire | 0.0 /100 | #322 | Tragic 40.1% |
| Puerto Ricans | 0.0 /100 | #323 | Tragic 40.1% |
| Navajo | 0.0 /100 | #324 | Tragic 40.1% |
| Pueblo | 0.0 /100 | #325 | Tragic 40.0% |
| U.S. Virgin Islanders | 0.0 /100 | #326 | Tragic 39.8% |
| Lumbee | 0.0 /100 | #327 | Tragic 39.6% |