Eastern European vs West Indian Married-couple Households
COMPARE
Eastern European
West Indian
Married-couple Households
Married-couple Households Comparison
Eastern Europeans
West Indians
48.6%
MARRIED-COUPLE HOUSEHOLDS
99.3/ 100
METRIC RATING
51st/ 347
METRIC RANK
40.3%
MARRIED-COUPLE HOUSEHOLDS
0.0/ 100
METRIC RATING
320th/ 347
METRIC RANK
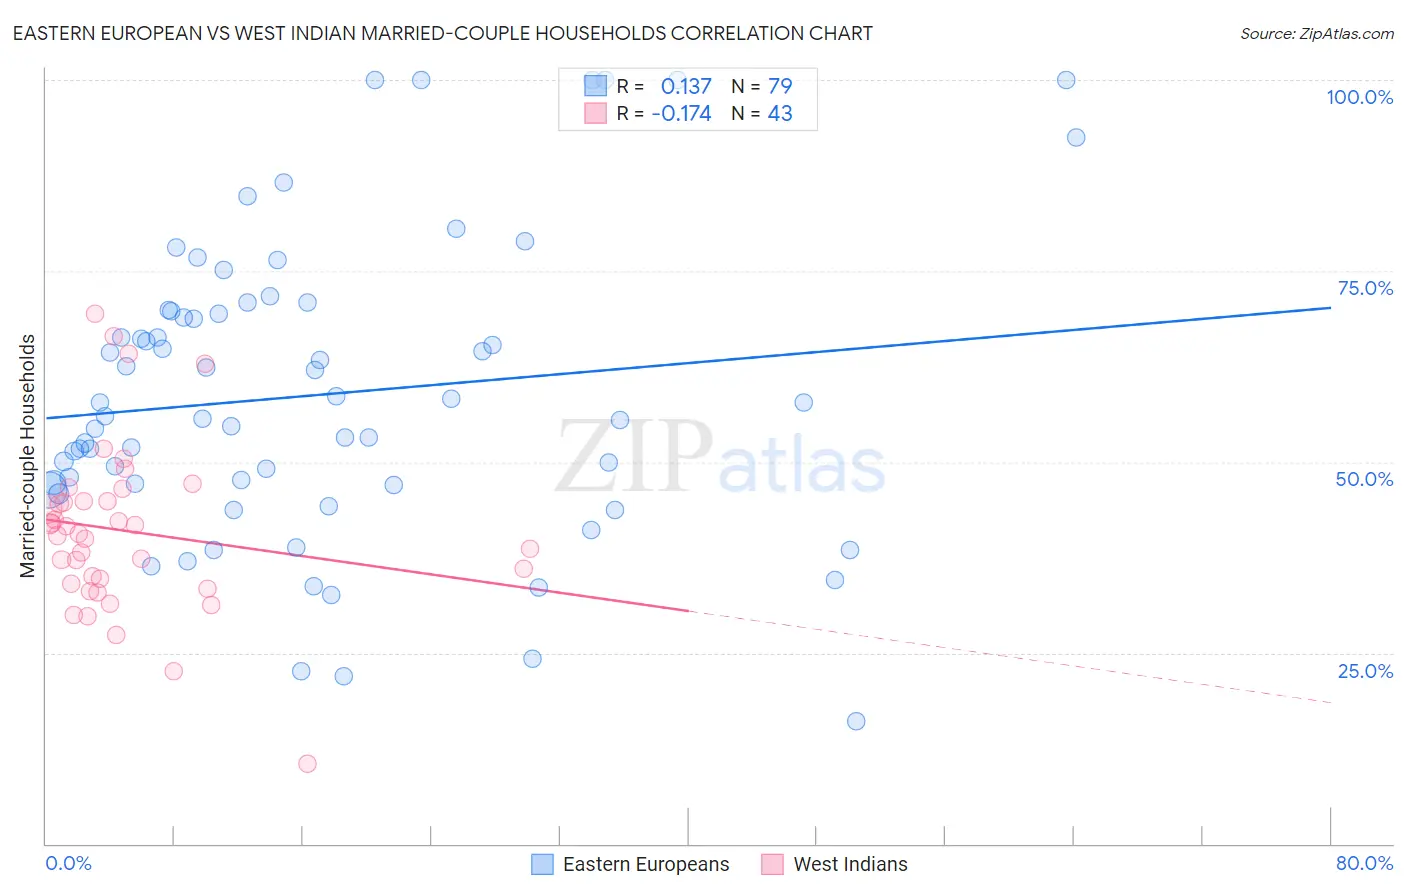
Eastern European vs West Indian Married-couple Households Correlation Chart
The statistical analysis conducted on geographies consisting of 460,944,660 people shows a poor positive correlation between the proportion of Eastern Europeans and percentage of married-couple family households in the United States with a correlation coefficient (R) of 0.137 and weighted average of 48.6%. Similarly, the statistical analysis conducted on geographies consisting of 253,854,054 people shows a poor negative correlation between the proportion of West Indians and percentage of married-couple family households in the United States with a correlation coefficient (R) of -0.174 and weighted average of 40.3%, a difference of 20.6%.
Married-couple Households Correlation Summary
| Measurement | Eastern European | West Indian |
| Minimum | 16.0% | 10.5% |
| Maximum | 100.0% | 69.4% |
| Range | 84.0% | 58.9% |
| Mean | 58.8% | 40.9% |
| Median | 55.9% | 40.5% |
| Interquartile 25% (IQ1) | 47.0% | 34.0% |
| Interquartile 75% (IQ3) | 69.8% | 44.9% |
| Interquartile Range (IQR) | 22.8% | 10.8% |
| Standard Deviation (Sample) | 19.4% | 11.1% |
| Standard Deviation (Population) | 19.3% | 11.0% |
Similar Demographics by Married-couple Households
Demographics Similar to Eastern Europeans by Married-couple Households
In terms of married-couple households, the demographic groups most similar to Eastern Europeans are Samoan (48.7%, a difference of 0.040%), Irish (48.6%, a difference of 0.040%), Immigrants from Sri Lanka (48.7%, a difference of 0.080%), White/Caucasian (48.6%, a difference of 0.090%), and Immigrants from Lithuania (48.6%, a difference of 0.090%).
| Demographics | Rating | Rank | Married-couple Households |
| Welsh | 99.5 /100 | #44 | Exceptional 48.8% |
| Immigrants | Eastern Asia | 99.5 /100 | #45 | Exceptional 48.8% |
| Tsimshian | 99.5 /100 | #46 | Exceptional 48.7% |
| British | 99.5 /100 | #47 | Exceptional 48.7% |
| Indians (Asian) | 99.4 /100 | #48 | Exceptional 48.7% |
| Immigrants | Sri Lanka | 99.4 /100 | #49 | Exceptional 48.7% |
| Samoans | 99.4 /100 | #50 | Exceptional 48.7% |
| Eastern Europeans | 99.3 /100 | #51 | Exceptional 48.6% |
| Irish | 99.3 /100 | #52 | Exceptional 48.6% |
| Whites/Caucasians | 99.3 /100 | #53 | Exceptional 48.6% |
| Immigrants | Lithuania | 99.3 /100 | #54 | Exceptional 48.6% |
| Austrians | 99.3 /100 | #55 | Exceptional 48.6% |
| Immigrants | Northern Europe | 99.3 /100 | #56 | Exceptional 48.6% |
| Poles | 99.2 /100 | #57 | Exceptional 48.5% |
| Immigrants | Indonesia | 99.2 /100 | #58 | Exceptional 48.5% |
Demographics Similar to West Indians by Married-couple Households
In terms of married-couple households, the demographic groups most similar to West Indians are Immigrants from Liberia (40.3%, a difference of 0.040%), Bahamian (40.5%, a difference of 0.42%), Immigrants from Zaire (40.1%, a difference of 0.70%), Puerto Rican (40.1%, a difference of 0.70%), and Navajo (40.1%, a difference of 0.71%).
| Demographics | Rating | Rank | Married-couple Households |
| Immigrants | Haiti | 0.0 /100 | #313 | Tragic 40.9% |
| Jamaicans | 0.0 /100 | #314 | Tragic 40.9% |
| Trinidadians and Tobagonians | 0.0 /100 | #315 | Tragic 40.9% |
| Immigrants | Caribbean | 0.0 /100 | #316 | Tragic 40.8% |
| Immigrants | Jamaica | 0.0 /100 | #317 | Tragic 40.7% |
| Liberians | 0.0 /100 | #318 | Tragic 40.7% |
| Bahamians | 0.0 /100 | #319 | Tragic 40.5% |
| West Indians | 0.0 /100 | #320 | Tragic 40.3% |
| Immigrants | Liberia | 0.0 /100 | #321 | Tragic 40.3% |
| Immigrants | Zaire | 0.0 /100 | #322 | Tragic 40.1% |
| Puerto Ricans | 0.0 /100 | #323 | Tragic 40.1% |
| Navajo | 0.0 /100 | #324 | Tragic 40.1% |
| Pueblo | 0.0 /100 | #325 | Tragic 40.0% |
| U.S. Virgin Islanders | 0.0 /100 | #326 | Tragic 39.8% |
| Lumbee | 0.0 /100 | #327 | Tragic 39.6% |