Kenyan vs West Indian Married-couple Households
COMPARE
Kenyan
West Indian
Married-couple Households
Married-couple Households Comparison
Kenyans
West Indians
44.7%
MARRIED-COUPLE HOUSEHOLDS
1.7/ 100
METRIC RATING
228th/ 347
METRIC RANK
40.3%
MARRIED-COUPLE HOUSEHOLDS
0.0/ 100
METRIC RATING
320th/ 347
METRIC RANK
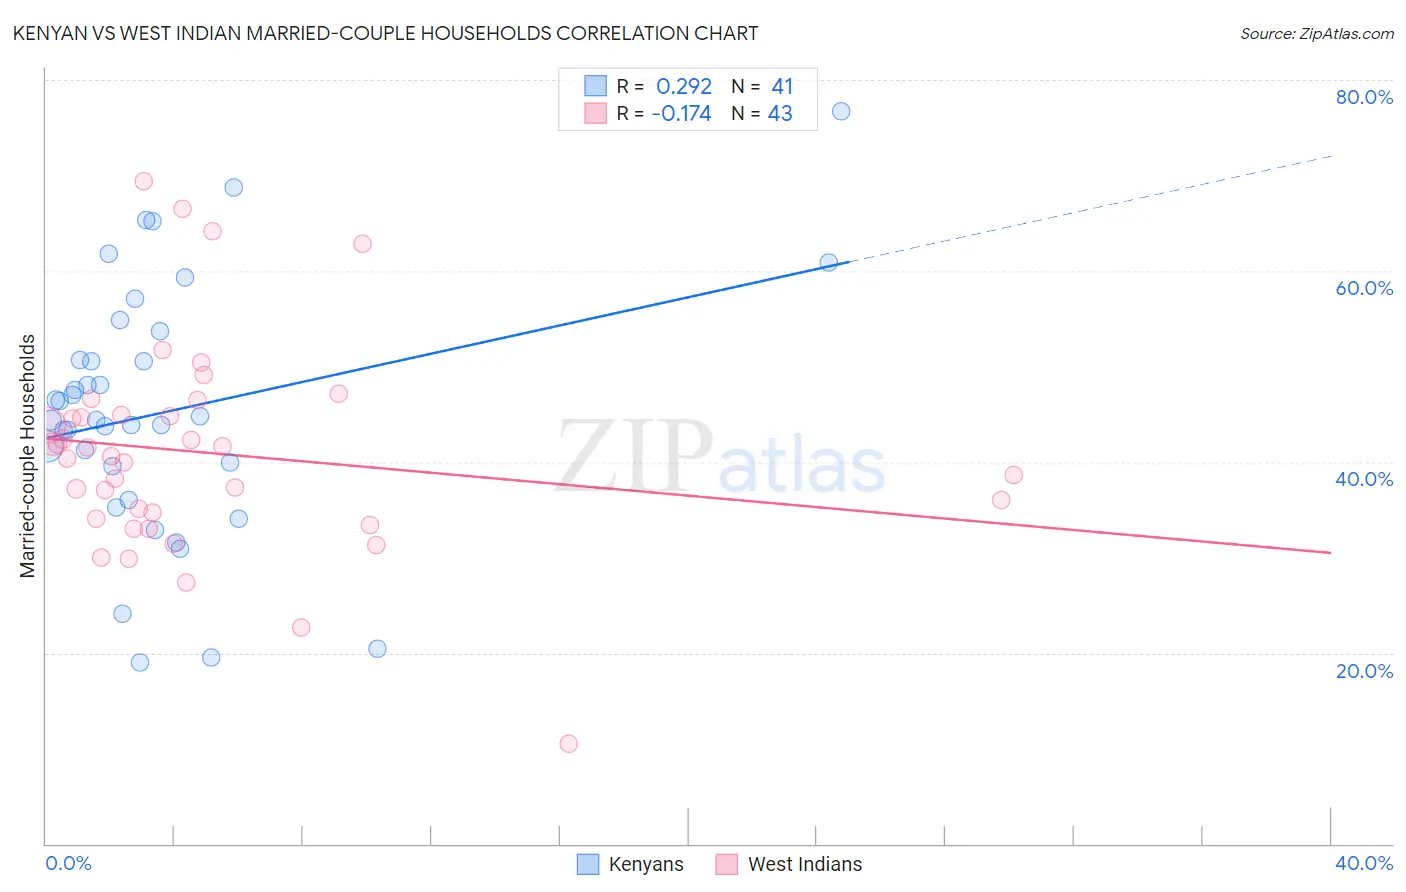
Kenyan vs West Indian Married-couple Households Correlation Chart
The statistical analysis conducted on geographies consisting of 168,165,214 people shows a weak positive correlation between the proportion of Kenyans and percentage of married-couple family households in the United States with a correlation coefficient (R) of 0.292 and weighted average of 44.7%. Similarly, the statistical analysis conducted on geographies consisting of 253,854,054 people shows a poor negative correlation between the proportion of West Indians and percentage of married-couple family households in the United States with a correlation coefficient (R) of -0.174 and weighted average of 40.3%, a difference of 10.7%.
Married-couple Households Correlation Summary
| Measurement | Kenyan | West Indian |
| Minimum | 18.9% | 10.5% |
| Maximum | 76.7% | 69.4% |
| Range | 57.7% | 58.9% |
| Mean | 45.3% | 40.9% |
| Median | 44.4% | 40.5% |
| Interquartile 25% (IQ1) | 37.8% | 34.0% |
| Interquartile 75% (IQ3) | 52.2% | 44.9% |
| Interquartile Range (IQR) | 14.4% | 10.8% |
| Standard Deviation (Sample) | 13.1% | 11.1% |
| Standard Deviation (Population) | 12.9% | 11.0% |
Similar Demographics by Married-couple Households
Demographics Similar to Kenyans by Married-couple Households
In terms of married-couple households, the demographic groups most similar to Kenyans are Immigrants from Latin America (44.7%, a difference of 0.050%), Soviet Union (44.6%, a difference of 0.090%), Houma (44.6%, a difference of 0.10%), Marshallese (44.6%, a difference of 0.10%), and Salvadoran (44.7%, a difference of 0.13%).
| Demographics | Rating | Rank | Married-couple Households |
| Tlingit-Haida | 4.9 /100 | #221 | Tragic 45.1% |
| Immigrants | Laos | 4.6 /100 | #222 | Tragic 45.1% |
| Immigrants | Cambodia | 2.7 /100 | #223 | Tragic 44.9% |
| Immigrants | Micronesia | 2.6 /100 | #224 | Tragic 44.9% |
| Dutch West Indians | 2.6 /100 | #225 | Tragic 44.9% |
| Alsatians | 2.3 /100 | #226 | Tragic 44.8% |
| Salvadorans | 1.9 /100 | #227 | Tragic 44.7% |
| Kenyans | 1.7 /100 | #228 | Tragic 44.7% |
| Immigrants | Latin America | 1.6 /100 | #229 | Tragic 44.7% |
| Soviet Union | 1.6 /100 | #230 | Tragic 44.6% |
| Houma | 1.5 /100 | #231 | Tragic 44.6% |
| Marshallese | 1.5 /100 | #232 | Tragic 44.6% |
| Immigrants | Uganda | 1.5 /100 | #233 | Tragic 44.6% |
| Immigrants | Panama | 1.3 /100 | #234 | Tragic 44.6% |
| Immigrants | Nicaragua | 1.2 /100 | #235 | Tragic 44.5% |
Demographics Similar to West Indians by Married-couple Households
In terms of married-couple households, the demographic groups most similar to West Indians are Immigrants from Liberia (40.3%, a difference of 0.040%), Bahamian (40.5%, a difference of 0.42%), Immigrants from Zaire (40.1%, a difference of 0.70%), Puerto Rican (40.1%, a difference of 0.70%), and Navajo (40.1%, a difference of 0.71%).
| Demographics | Rating | Rank | Married-couple Households |
| Immigrants | Haiti | 0.0 /100 | #313 | Tragic 40.9% |
| Jamaicans | 0.0 /100 | #314 | Tragic 40.9% |
| Trinidadians and Tobagonians | 0.0 /100 | #315 | Tragic 40.9% |
| Immigrants | Caribbean | 0.0 /100 | #316 | Tragic 40.8% |
| Immigrants | Jamaica | 0.0 /100 | #317 | Tragic 40.7% |
| Liberians | 0.0 /100 | #318 | Tragic 40.7% |
| Bahamians | 0.0 /100 | #319 | Tragic 40.5% |
| West Indians | 0.0 /100 | #320 | Tragic 40.3% |
| Immigrants | Liberia | 0.0 /100 | #321 | Tragic 40.3% |
| Immigrants | Zaire | 0.0 /100 | #322 | Tragic 40.1% |
| Puerto Ricans | 0.0 /100 | #323 | Tragic 40.1% |
| Navajo | 0.0 /100 | #324 | Tragic 40.1% |
| Pueblo | 0.0 /100 | #325 | Tragic 40.0% |
| U.S. Virgin Islanders | 0.0 /100 | #326 | Tragic 39.8% |
| Lumbee | 0.0 /100 | #327 | Tragic 39.6% |