Pueblo vs Palestinian Cognitive Disability
COMPARE
Pueblo
Palestinian
Cognitive Disability
Cognitive Disability Comparison
Pueblo
Palestinians
18.7%
COGNITIVE DISABILITY
0.0/ 100
METRIC RATING
323rd/ 347
METRIC RANK
16.8%
COGNITIVE DISABILITY
98.0/ 100
METRIC RATING
104th/ 347
METRIC RANK
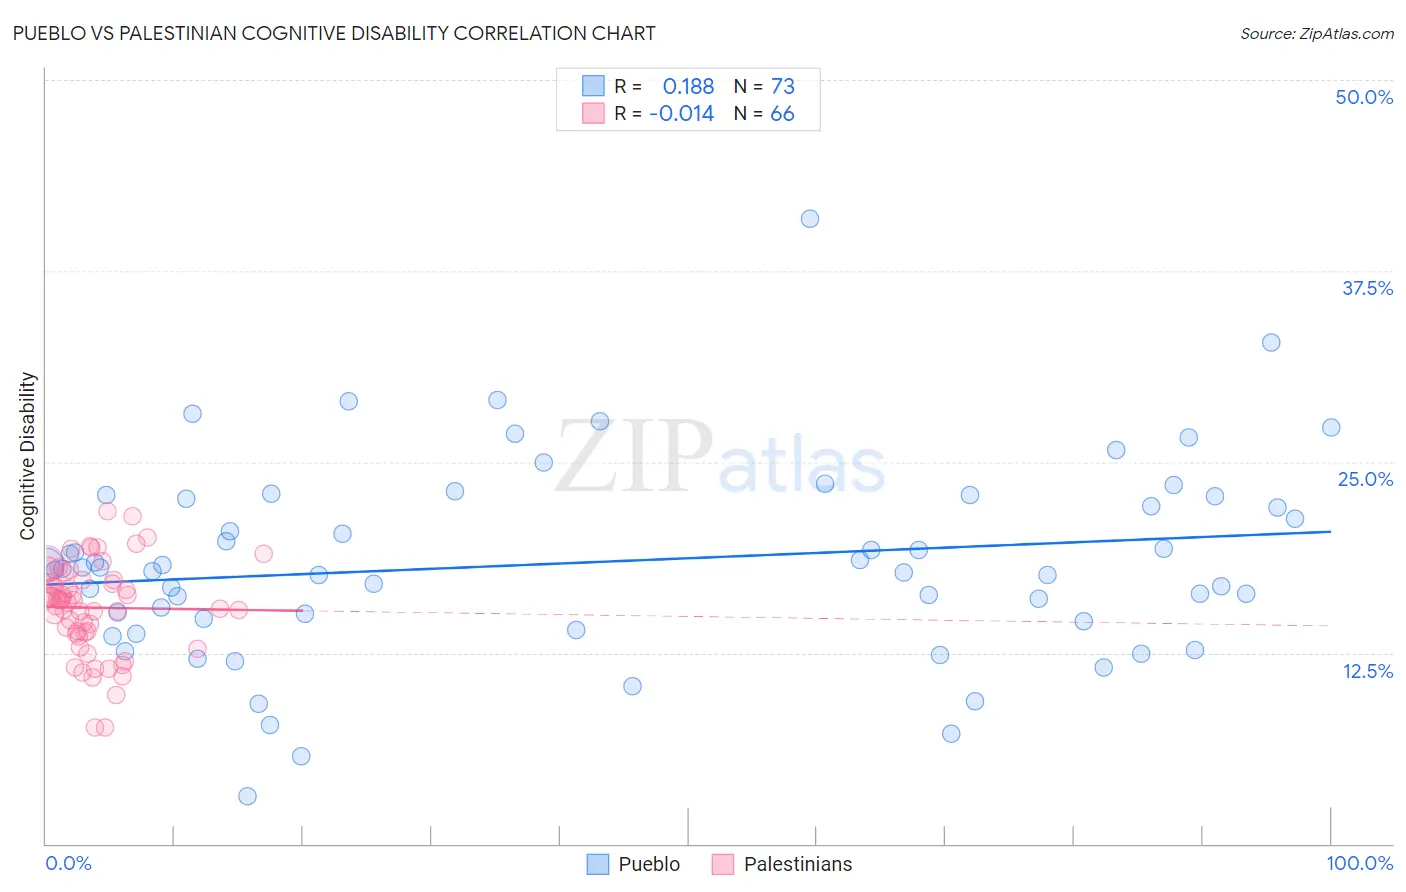
Pueblo vs Palestinian Cognitive Disability Correlation Chart
The statistical analysis conducted on geographies consisting of 120,078,702 people shows a poor positive correlation between the proportion of Pueblo and percentage of population with cognitive disability in the United States with a correlation coefficient (R) of 0.188 and weighted average of 18.7%. Similarly, the statistical analysis conducted on geographies consisting of 216,464,983 people shows no correlation between the proportion of Palestinians and percentage of population with cognitive disability in the United States with a correlation coefficient (R) of -0.014 and weighted average of 16.8%, a difference of 11.0%.
Cognitive Disability Correlation Summary
| Measurement | Pueblo | Palestinian |
| Minimum | 3.1% | 7.6% |
| Maximum | 40.9% | 21.7% |
| Range | 37.7% | 14.1% |
| Mean | 18.4% | 15.5% |
| Median | 18.0% | 16.0% |
| Interquartile 25% (IQ1) | 14.7% | 13.8% |
| Interquartile 75% (IQ3) | 22.7% | 17.3% |
| Interquartile Range (IQR) | 8.0% | 3.4% |
| Standard Deviation (Sample) | 6.4% | 3.0% |
| Standard Deviation (Population) | 6.3% | 3.0% |
Similar Demographics by Cognitive Disability
Demographics Similar to Pueblo by Cognitive Disability
In terms of cognitive disability, the demographic groups most similar to Pueblo are Immigrants from Liberia (18.7%, a difference of 0.020%), African (18.6%, a difference of 0.080%), Dominican (18.7%, a difference of 0.12%), Apache (18.6%, a difference of 0.17%), and Indonesian (18.7%, a difference of 0.20%).
| Demographics | Rating | Rank | Cognitive Disability |
| Immigrants | Middle Africa | 0.0 /100 | #316 | Tragic 18.6% |
| Liberians | 0.0 /100 | #317 | Tragic 18.6% |
| Bangladeshis | 0.0 /100 | #318 | Tragic 18.6% |
| Comanche | 0.0 /100 | #319 | Tragic 18.6% |
| Apache | 0.0 /100 | #320 | Tragic 18.6% |
| Africans | 0.0 /100 | #321 | Tragic 18.6% |
| Immigrants | Liberia | 0.0 /100 | #322 | Tragic 18.7% |
| Pueblo | 0.0 /100 | #323 | Tragic 18.7% |
| Dominicans | 0.0 /100 | #324 | Tragic 18.7% |
| Indonesians | 0.0 /100 | #325 | Tragic 18.7% |
| Immigrants | Senegal | 0.0 /100 | #326 | Tragic 18.7% |
| U.S. Virgin Islanders | 0.0 /100 | #327 | Tragic 18.7% |
| Kiowa | 0.0 /100 | #328 | Tragic 18.7% |
| Navajo | 0.0 /100 | #329 | Tragic 18.8% |
| Immigrants | Dominican Republic | 0.0 /100 | #330 | Tragic 18.8% |
Demographics Similar to Palestinians by Cognitive Disability
In terms of cognitive disability, the demographic groups most similar to Palestinians are Paraguayan (16.8%, a difference of 0.0%), Immigrants from Eastern Asia (16.8%, a difference of 0.010%), Irish (16.8%, a difference of 0.050%), Northern European (16.8%, a difference of 0.050%), and Immigrants from Asia (16.8%, a difference of 0.070%).
| Demographics | Rating | Rank | Cognitive Disability |
| Dutch | 98.5 /100 | #97 | Exceptional 16.8% |
| Immigrants | Lebanon | 98.4 /100 | #98 | Exceptional 16.8% |
| Jordanians | 98.2 /100 | #99 | Exceptional 16.8% |
| Immigrants | Russia | 98.2 /100 | #100 | Exceptional 16.8% |
| Immigrants | Asia | 98.1 /100 | #101 | Exceptional 16.8% |
| Irish | 98.1 /100 | #102 | Exceptional 16.8% |
| Paraguayans | 98.0 /100 | #103 | Exceptional 16.8% |
| Palestinians | 98.0 /100 | #104 | Exceptional 16.8% |
| Immigrants | Eastern Asia | 97.9 /100 | #105 | Exceptional 16.8% |
| Northern Europeans | 97.8 /100 | #106 | Exceptional 16.8% |
| Immigrants | Nicaragua | 97.8 /100 | #107 | Exceptional 16.8% |
| Canadians | 97.5 /100 | #108 | Exceptional 16.8% |
| Albanians | 97.3 /100 | #109 | Exceptional 16.8% |
| Arapaho | 97.3 /100 | #110 | Exceptional 16.8% |
| Uruguayans | 97.2 /100 | #111 | Exceptional 16.8% |