Pueblo vs Polish Currently Married
COMPARE
Pueblo
Polish
Currently Married
Currently Married Comparison
Pueblo
Poles
38.2%
CURRENTLY MARRIED
0.0/ 100
METRIC RATING
343rd/ 347
METRIC RANK
48.9%
CURRENTLY MARRIED
99.5/ 100
METRIC RATING
31st/ 347
METRIC RANK
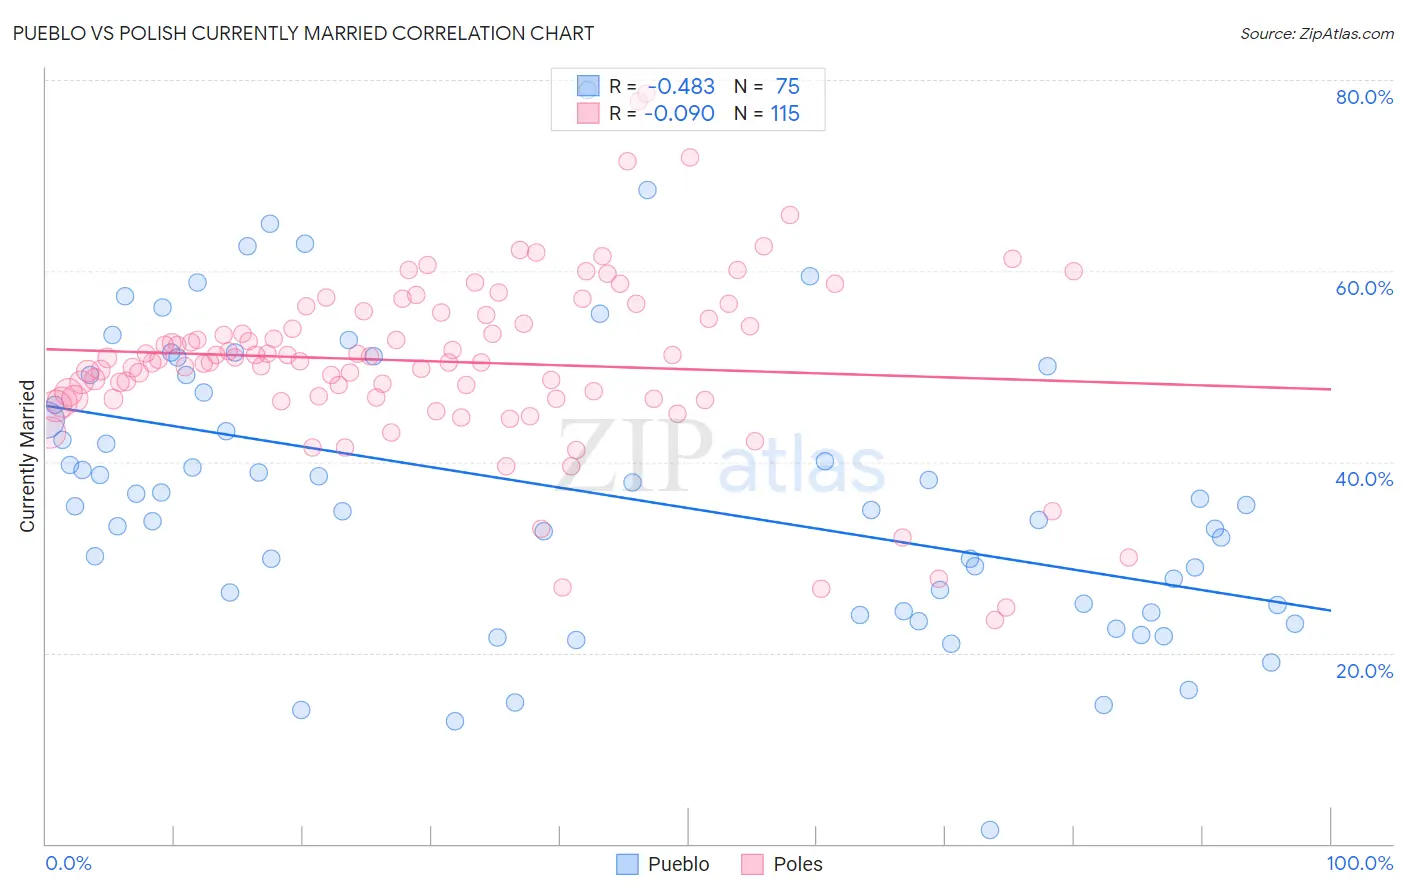
Pueblo vs Polish Currently Married Correlation Chart
The statistical analysis conducted on geographies consisting of 120,084,421 people shows a moderate negative correlation between the proportion of Pueblo and percentage of population currently married in the United States with a correlation coefficient (R) of -0.483 and weighted average of 38.2%. Similarly, the statistical analysis conducted on geographies consisting of 560,467,827 people shows a slight negative correlation between the proportion of Poles and percentage of population currently married in the United States with a correlation coefficient (R) of -0.090 and weighted average of 48.9%, a difference of 27.9%.
Currently Married Correlation Summary
| Measurement | Pueblo | Polish |
| Minimum | 1.5% | 23.5% |
| Maximum | 78.9% | 78.6% |
| Range | 77.4% | 55.1% |
| Mean | 36.9% | 50.5% |
| Median | 35.5% | 50.7% |
| Interquartile 25% (IQ1) | 25.0% | 46.6% |
| Interquartile 75% (IQ3) | 49.1% | 55.6% |
| Interquartile Range (IQR) | 24.0% | 9.0% |
| Standard Deviation (Sample) | 14.9% | 9.4% |
| Standard Deviation (Population) | 14.8% | 9.3% |
Similar Demographics by Currently Married
Demographics Similar to Pueblo by Currently Married
In terms of currently married, the demographic groups most similar to Pueblo are Immigrants from Cabo Verde (37.8%, a difference of 1.1%), Immigrants from Dominican Republic (38.9%, a difference of 1.8%), Navajo (39.0%, a difference of 2.0%), Immigrants from Grenada (39.1%, a difference of 2.4%), and Dominican (39.5%, a difference of 3.4%).
| Demographics | Rating | Rank | Currently Married |
| Yup'ik | 0.0 /100 | #333 | Tragic 39.9% |
| Puerto Ricans | 0.0 /100 | #334 | Tragic 39.9% |
| Lumbee | 0.0 /100 | #335 | Tragic 39.8% |
| British West Indians | 0.0 /100 | #336 | Tragic 39.8% |
| Blacks/African Americans | 0.0 /100 | #337 | Tragic 39.6% |
| Cape Verdeans | 0.0 /100 | #338 | Tragic 39.6% |
| Dominicans | 0.0 /100 | #339 | Tragic 39.5% |
| Immigrants | Grenada | 0.0 /100 | #340 | Tragic 39.1% |
| Navajo | 0.0 /100 | #341 | Tragic 39.0% |
| Immigrants | Dominican Republic | 0.0 /100 | #342 | Tragic 38.9% |
| Pueblo | 0.0 /100 | #343 | Tragic 38.2% |
| Immigrants | Cabo Verde | 0.0 /100 | #344 | Tragic 37.8% |
| Tohono O'odham | 0.0 /100 | #345 | Tragic 36.8% |
| Hopi | 0.0 /100 | #346 | Tragic 36.5% |
| Pima | 0.0 /100 | #347 | Tragic 35.9% |
Demographics Similar to Poles by Currently Married
In terms of currently married, the demographic groups most similar to Poles are Eastern European (48.9%, a difference of 0.0%), Croatian (48.9%, a difference of 0.010%), Immigrants from Hong Kong (48.9%, a difference of 0.010%), Irish (48.9%, a difference of 0.050%), and Welsh (48.9%, a difference of 0.060%).
| Demographics | Rating | Rank | Currently Married |
| Lithuanians | 99.6 /100 | #24 | Exceptional 49.0% |
| Maltese | 99.6 /100 | #25 | Exceptional 49.0% |
| Immigrants | Korea | 99.6 /100 | #26 | Exceptional 49.0% |
| Burmese | 99.6 /100 | #27 | Exceptional 48.9% |
| Welsh | 99.5 /100 | #28 | Exceptional 48.9% |
| Croatians | 99.5 /100 | #29 | Exceptional 48.9% |
| Eastern Europeans | 99.5 /100 | #30 | Exceptional 48.9% |
| Poles | 99.5 /100 | #31 | Exceptional 48.9% |
| Immigrants | Hong Kong | 99.5 /100 | #32 | Exceptional 48.9% |
| Irish | 99.5 /100 | #33 | Exceptional 48.9% |
| Immigrants | Lithuania | 99.4 /100 | #34 | Exceptional 48.8% |
| Immigrants | Northern Europe | 99.4 /100 | #35 | Exceptional 48.8% |
| Italians | 99.4 /100 | #36 | Exceptional 48.8% |
| Hungarians | 99.4 /100 | #37 | Exceptional 48.8% |
| Czechoslovakians | 99.4 /100 | #38 | Exceptional 48.8% |