Pueblo vs Cheyenne Currently Married
COMPARE
Pueblo
Cheyenne
Currently Married
Currently Married Comparison
Pueblo
Cheyenne
38.2%
CURRENTLY MARRIED
0.0/ 100
METRIC RATING
343rd/ 347
METRIC RANK
42.2%
CURRENTLY MARRIED
0.0/ 100
METRIC RATING
297th/ 347
METRIC RANK
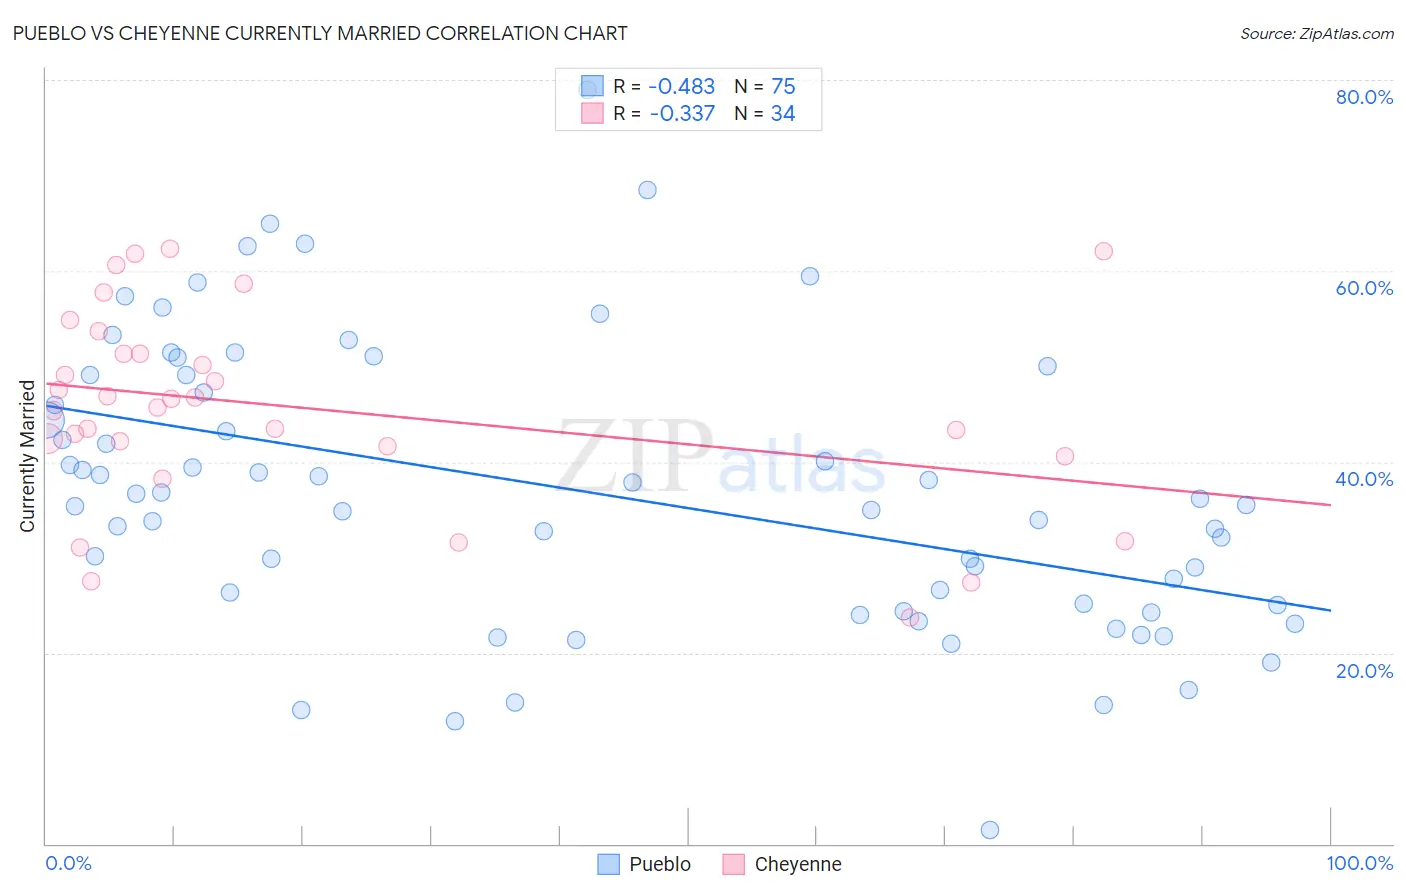
Pueblo vs Cheyenne Currently Married Correlation Chart
The statistical analysis conducted on geographies consisting of 120,084,421 people shows a moderate negative correlation between the proportion of Pueblo and percentage of population currently married in the United States with a correlation coefficient (R) of -0.483 and weighted average of 38.2%. Similarly, the statistical analysis conducted on geographies consisting of 80,721,070 people shows a mild negative correlation between the proportion of Cheyenne and percentage of population currently married in the United States with a correlation coefficient (R) of -0.337 and weighted average of 42.2%, a difference of 10.5%.
Currently Married Correlation Summary
| Measurement | Pueblo | Cheyenne |
| Minimum | 1.5% | 23.7% |
| Maximum | 78.9% | 62.3% |
| Range | 77.4% | 38.6% |
| Mean | 36.9% | 45.6% |
| Median | 35.5% | 46.1% |
| Interquartile 25% (IQ1) | 25.0% | 41.6% |
| Interquartile 75% (IQ3) | 49.1% | 51.4% |
| Interquartile Range (IQR) | 24.0% | 9.8% |
| Standard Deviation (Sample) | 14.9% | 10.3% |
| Standard Deviation (Population) | 14.8% | 10.2% |
Similar Demographics by Currently Married
Demographics Similar to Pueblo by Currently Married
In terms of currently married, the demographic groups most similar to Pueblo are Immigrants from Cabo Verde (37.8%, a difference of 1.1%), Immigrants from Dominican Republic (38.9%, a difference of 1.8%), Navajo (39.0%, a difference of 2.0%), Immigrants from Grenada (39.1%, a difference of 2.4%), and Dominican (39.5%, a difference of 3.4%).
| Demographics | Rating | Rank | Currently Married |
| Yup'ik | 0.0 /100 | #333 | Tragic 39.9% |
| Puerto Ricans | 0.0 /100 | #334 | Tragic 39.9% |
| Lumbee | 0.0 /100 | #335 | Tragic 39.8% |
| British West Indians | 0.0 /100 | #336 | Tragic 39.8% |
| Blacks/African Americans | 0.0 /100 | #337 | Tragic 39.6% |
| Cape Verdeans | 0.0 /100 | #338 | Tragic 39.6% |
| Dominicans | 0.0 /100 | #339 | Tragic 39.5% |
| Immigrants | Grenada | 0.0 /100 | #340 | Tragic 39.1% |
| Navajo | 0.0 /100 | #341 | Tragic 39.0% |
| Immigrants | Dominican Republic | 0.0 /100 | #342 | Tragic 38.9% |
| Pueblo | 0.0 /100 | #343 | Tragic 38.2% |
| Immigrants | Cabo Verde | 0.0 /100 | #344 | Tragic 37.8% |
| Tohono O'odham | 0.0 /100 | #345 | Tragic 36.8% |
| Hopi | 0.0 /100 | #346 | Tragic 36.5% |
| Pima | 0.0 /100 | #347 | Tragic 35.9% |
Demographics Similar to Cheyenne by Currently Married
In terms of currently married, the demographic groups most similar to Cheyenne are Immigrants from Honduras (42.2%, a difference of 0.090%), Menominee (42.3%, a difference of 0.11%), Liberian (42.2%, a difference of 0.12%), Belizean (42.2%, a difference of 0.22%), and Immigrants from Western Africa (42.4%, a difference of 0.31%).
| Demographics | Rating | Rank | Currently Married |
| Immigrants | Ghana | 0.0 /100 | #290 | Tragic 42.7% |
| Immigrants | Guatemala | 0.0 /100 | #291 | Tragic 42.6% |
| Sub-Saharan Africans | 0.0 /100 | #292 | Tragic 42.6% |
| Yuman | 0.0 /100 | #293 | Tragic 42.6% |
| Hondurans | 0.0 /100 | #294 | Tragic 42.5% |
| Immigrants | Western Africa | 0.0 /100 | #295 | Tragic 42.4% |
| Menominee | 0.0 /100 | #296 | Tragic 42.3% |
| Cheyenne | 0.0 /100 | #297 | Tragic 42.2% |
| Immigrants | Honduras | 0.0 /100 | #298 | Tragic 42.2% |
| Liberians | 0.0 /100 | #299 | Tragic 42.2% |
| Belizeans | 0.0 /100 | #300 | Tragic 42.2% |
| Immigrants | Yemen | 0.0 /100 | #301 | Tragic 42.1% |
| Immigrants | Zaire | 0.0 /100 | #302 | Tragic 42.0% |
| Sioux | 0.0 /100 | #303 | Tragic 41.9% |
| Immigrants | Bahamas | 0.0 /100 | #304 | Tragic 41.9% |