Pueblo vs Immigrants from Nicaragua Currently Married
COMPARE
Pueblo
Immigrants from Nicaragua
Currently Married
Currently Married Comparison
Pueblo
Immigrants from Nicaragua
38.2%
CURRENTLY MARRIED
0.0/ 100
METRIC RATING
343rd/ 347
METRIC RANK
43.7%
CURRENTLY MARRIED
0.1/ 100
METRIC RATING
261st/ 347
METRIC RANK
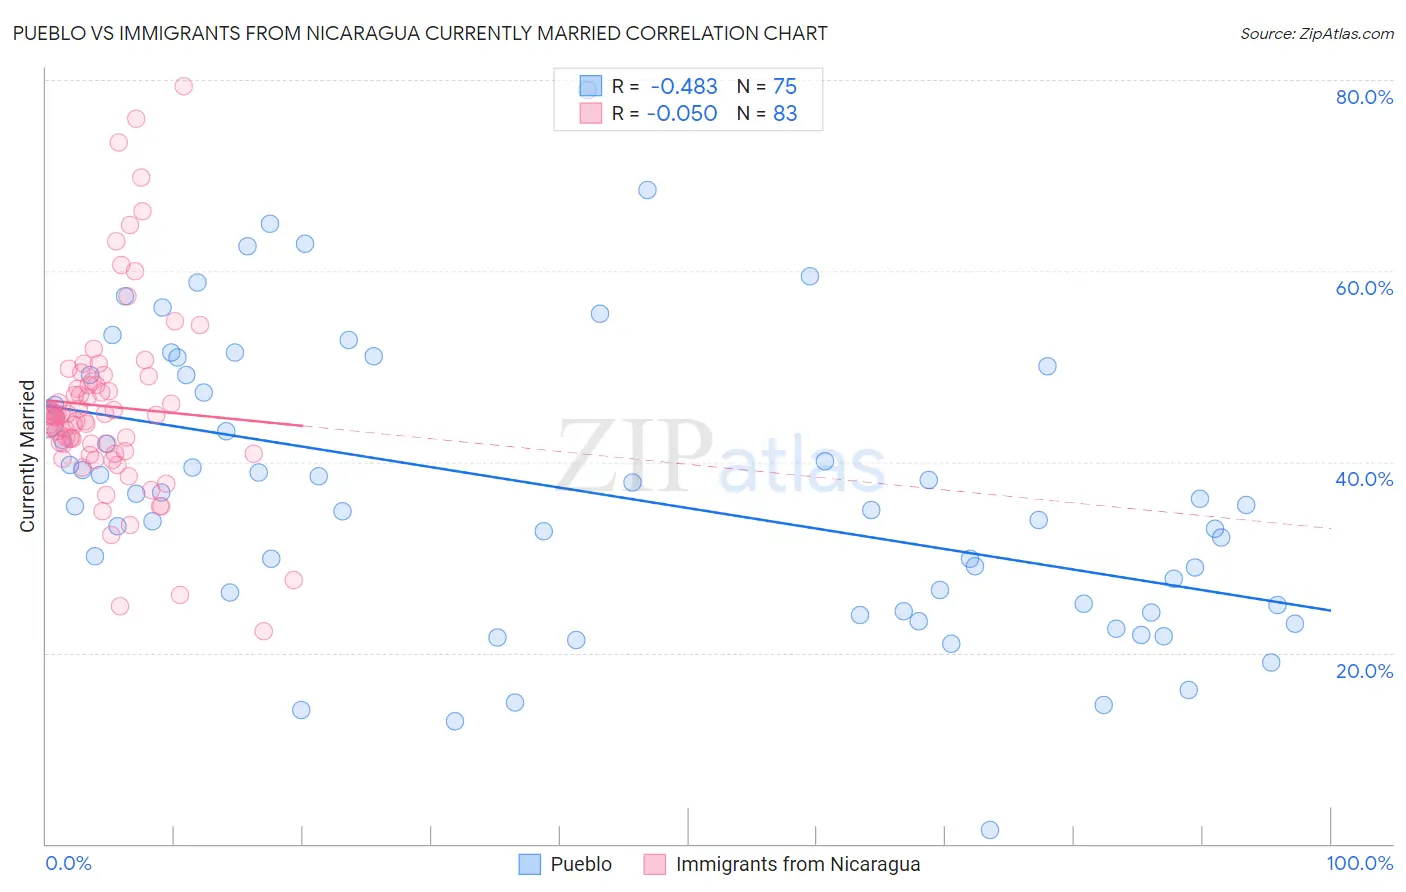
Pueblo vs Immigrants from Nicaragua Currently Married Correlation Chart
The statistical analysis conducted on geographies consisting of 120,084,421 people shows a moderate negative correlation between the proportion of Pueblo and percentage of population currently married in the United States with a correlation coefficient (R) of -0.483 and weighted average of 38.2%. Similarly, the statistical analysis conducted on geographies consisting of 236,341,700 people shows a slight negative correlation between the proportion of Immigrants from Nicaragua and percentage of population currently married in the United States with a correlation coefficient (R) of -0.050 and weighted average of 43.7%, a difference of 14.4%.
Currently Married Correlation Summary
| Measurement | Pueblo | Immigrants from Nicaragua |
| Minimum | 1.5% | 22.3% |
| Maximum | 78.9% | 79.4% |
| Range | 77.4% | 57.1% |
| Mean | 36.9% | 45.8% |
| Median | 35.5% | 44.9% |
| Interquartile 25% (IQ1) | 25.0% | 40.9% |
| Interquartile 75% (IQ3) | 49.1% | 48.4% |
| Interquartile Range (IQR) | 24.0% | 7.5% |
| Standard Deviation (Sample) | 14.9% | 10.1% |
| Standard Deviation (Population) | 14.8% | 10.1% |
Similar Demographics by Currently Married
Demographics Similar to Pueblo by Currently Married
In terms of currently married, the demographic groups most similar to Pueblo are Immigrants from Cabo Verde (37.8%, a difference of 1.1%), Immigrants from Dominican Republic (38.9%, a difference of 1.8%), Navajo (39.0%, a difference of 2.0%), Immigrants from Grenada (39.1%, a difference of 2.4%), and Dominican (39.5%, a difference of 3.4%).
| Demographics | Rating | Rank | Currently Married |
| Yup'ik | 0.0 /100 | #333 | Tragic 39.9% |
| Puerto Ricans | 0.0 /100 | #334 | Tragic 39.9% |
| Lumbee | 0.0 /100 | #335 | Tragic 39.8% |
| British West Indians | 0.0 /100 | #336 | Tragic 39.8% |
| Blacks/African Americans | 0.0 /100 | #337 | Tragic 39.6% |
| Cape Verdeans | 0.0 /100 | #338 | Tragic 39.6% |
| Dominicans | 0.0 /100 | #339 | Tragic 39.5% |
| Immigrants | Grenada | 0.0 /100 | #340 | Tragic 39.1% |
| Navajo | 0.0 /100 | #341 | Tragic 39.0% |
| Immigrants | Dominican Republic | 0.0 /100 | #342 | Tragic 38.9% |
| Pueblo | 0.0 /100 | #343 | Tragic 38.2% |
| Immigrants | Cabo Verde | 0.0 /100 | #344 | Tragic 37.8% |
| Tohono O'odham | 0.0 /100 | #345 | Tragic 36.8% |
| Hopi | 0.0 /100 | #346 | Tragic 36.5% |
| Pima | 0.0 /100 | #347 | Tragic 35.9% |
Demographics Similar to Immigrants from Nicaragua by Currently Married
In terms of currently married, the demographic groups most similar to Immigrants from Nicaragua are Immigrants from Latin America (43.8%, a difference of 0.040%), Immigrants from Sierra Leone (43.8%, a difference of 0.11%), Bangladeshi (43.7%, a difference of 0.14%), Immigrants from Cuba (43.7%, a difference of 0.18%), and Sudanese (43.7%, a difference of 0.19%).
| Demographics | Rating | Rank | Currently Married |
| Vietnamese | 0.2 /100 | #254 | Tragic 44.0% |
| Yakama | 0.2 /100 | #255 | Tragic 44.0% |
| Shoshone | 0.2 /100 | #256 | Tragic 44.0% |
| Immigrants | Africa | 0.2 /100 | #257 | Tragic 43.9% |
| Ute | 0.2 /100 | #258 | Tragic 43.9% |
| Immigrants | Sierra Leone | 0.1 /100 | #259 | Tragic 43.8% |
| Immigrants | Latin America | 0.1 /100 | #260 | Tragic 43.8% |
| Immigrants | Nicaragua | 0.1 /100 | #261 | Tragic 43.7% |
| Bangladeshis | 0.1 /100 | #262 | Tragic 43.7% |
| Immigrants | Cuba | 0.1 /100 | #263 | Tragic 43.7% |
| Sudanese | 0.1 /100 | #264 | Tragic 43.7% |
| Immigrants | Bangladesh | 0.1 /100 | #265 | Tragic 43.6% |
| Ecuadorians | 0.1 /100 | #266 | Tragic 43.6% |
| Immigrants | Eritrea | 0.1 /100 | #267 | Tragic 43.6% |
| Spanish American Indians | 0.1 /100 | #268 | Tragic 43.6% |