Pueblo vs Russian Currently Married
COMPARE
Pueblo
Russian
Currently Married
Currently Married Comparison
Pueblo
Russians
38.2%
CURRENTLY MARRIED
0.0/ 100
METRIC RATING
343rd/ 347
METRIC RANK
48.6%
CURRENTLY MARRIED
98.9/ 100
METRIC RATING
52nd/ 347
METRIC RANK
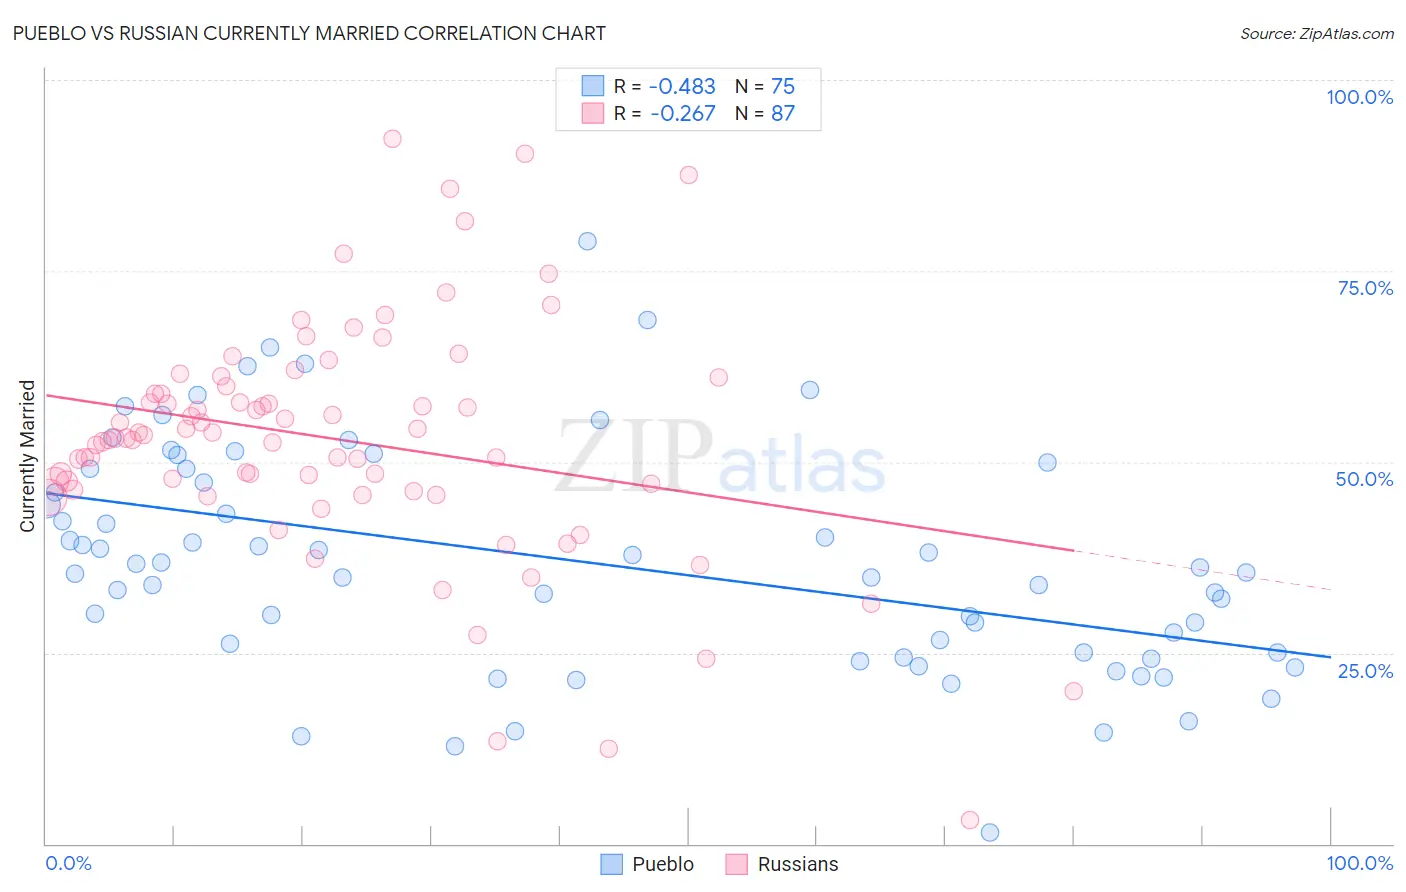
Pueblo vs Russian Currently Married Correlation Chart
The statistical analysis conducted on geographies consisting of 120,084,421 people shows a moderate negative correlation between the proportion of Pueblo and percentage of population currently married in the United States with a correlation coefficient (R) of -0.483 and weighted average of 38.2%. Similarly, the statistical analysis conducted on geographies consisting of 512,168,988 people shows a weak negative correlation between the proportion of Russians and percentage of population currently married in the United States with a correlation coefficient (R) of -0.267 and weighted average of 48.6%, a difference of 27.0%.
Currently Married Correlation Summary
| Measurement | Pueblo | Russian |
| Minimum | 1.5% | 3.1% |
| Maximum | 78.9% | 92.3% |
| Range | 77.4% | 89.2% |
| Mean | 36.9% | 52.9% |
| Median | 35.5% | 53.1% |
| Interquartile 25% (IQ1) | 25.0% | 46.3% |
| Interquartile 75% (IQ3) | 49.1% | 59.8% |
| Interquartile Range (IQR) | 24.0% | 13.5% |
| Standard Deviation (Sample) | 14.9% | 15.7% |
| Standard Deviation (Population) | 14.8% | 15.6% |
Similar Demographics by Currently Married
Demographics Similar to Pueblo by Currently Married
In terms of currently married, the demographic groups most similar to Pueblo are Immigrants from Cabo Verde (37.8%, a difference of 1.1%), Immigrants from Dominican Republic (38.9%, a difference of 1.8%), Navajo (39.0%, a difference of 2.0%), Immigrants from Grenada (39.1%, a difference of 2.4%), and Dominican (39.5%, a difference of 3.4%).
| Demographics | Rating | Rank | Currently Married |
| Yup'ik | 0.0 /100 | #333 | Tragic 39.9% |
| Puerto Ricans | 0.0 /100 | #334 | Tragic 39.9% |
| Lumbee | 0.0 /100 | #335 | Tragic 39.8% |
| British West Indians | 0.0 /100 | #336 | Tragic 39.8% |
| Blacks/African Americans | 0.0 /100 | #337 | Tragic 39.6% |
| Cape Verdeans | 0.0 /100 | #338 | Tragic 39.6% |
| Dominicans | 0.0 /100 | #339 | Tragic 39.5% |
| Immigrants | Grenada | 0.0 /100 | #340 | Tragic 39.1% |
| Navajo | 0.0 /100 | #341 | Tragic 39.0% |
| Immigrants | Dominican Republic | 0.0 /100 | #342 | Tragic 38.9% |
| Pueblo | 0.0 /100 | #343 | Tragic 38.2% |
| Immigrants | Cabo Verde | 0.0 /100 | #344 | Tragic 37.8% |
| Tohono O'odham | 0.0 /100 | #345 | Tragic 36.8% |
| Hopi | 0.0 /100 | #346 | Tragic 36.5% |
| Pima | 0.0 /100 | #347 | Tragic 35.9% |
Demographics Similar to Russians by Currently Married
In terms of currently married, the demographic groups most similar to Russians are Iranian (48.6%, a difference of 0.090%), White/Caucasian (48.6%, a difference of 0.090%), Immigrants from Austria (48.5%, a difference of 0.12%), Bhutanese (48.6%, a difference of 0.16%), and Immigrants from Moldova (48.5%, a difference of 0.18%).
| Demographics | Rating | Rank | Currently Married |
| Belgians | 99.3 /100 | #45 | Exceptional 48.7% |
| Immigrants | Iran | 99.2 /100 | #46 | Exceptional 48.7% |
| Northern Europeans | 99.2 /100 | #47 | Exceptional 48.7% |
| Austrians | 99.2 /100 | #48 | Exceptional 48.7% |
| Bhutanese | 99.1 /100 | #49 | Exceptional 48.6% |
| Iranians | 99.0 /100 | #50 | Exceptional 48.6% |
| Whites/Caucasians | 99.0 /100 | #51 | Exceptional 48.6% |
| Russians | 98.9 /100 | #52 | Exceptional 48.6% |
| Immigrants | Austria | 98.8 /100 | #53 | Exceptional 48.5% |
| Immigrants | Moldova | 98.7 /100 | #54 | Exceptional 48.5% |
| Immigrants | North Macedonia | 98.7 /100 | #55 | Exceptional 48.5% |
| Latvians | 98.7 /100 | #56 | Exceptional 48.5% |
| Immigrants | Netherlands | 98.6 /100 | #57 | Exceptional 48.5% |
| French | 98.6 /100 | #58 | Exceptional 48.4% |
| Immigrants | Ireland | 98.5 /100 | #59 | Exceptional 48.4% |