Haitian vs Cheyenne Currently Married
COMPARE
Haitian
Cheyenne
Currently Married
Currently Married Comparison
Haitians
Cheyenne
41.3%
CURRENTLY MARRIED
0.0/ 100
METRIC RATING
317th/ 347
METRIC RANK
42.2%
CURRENTLY MARRIED
0.0/ 100
METRIC RATING
297th/ 347
METRIC RANK
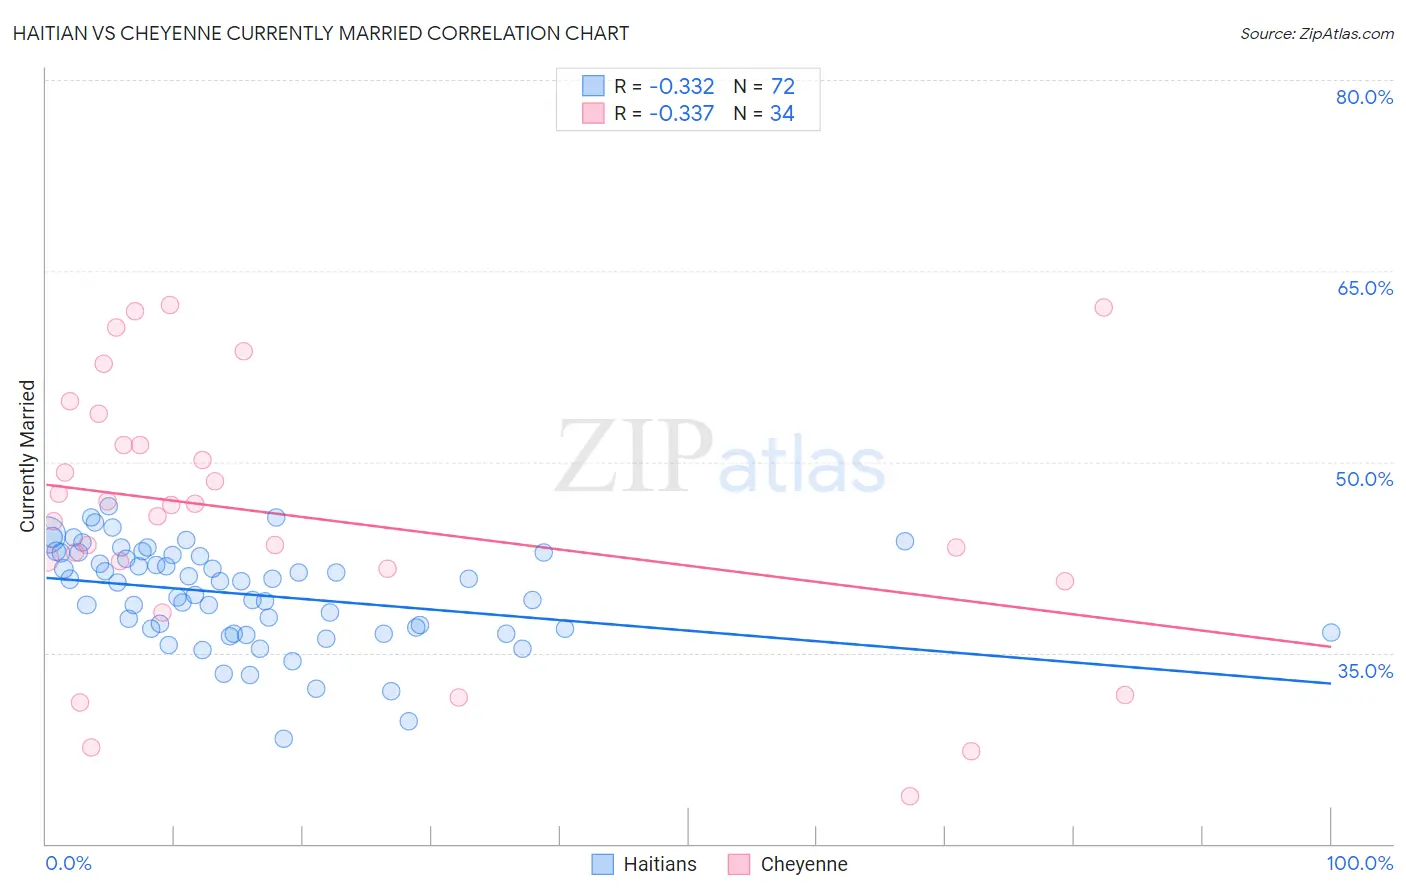
Haitian vs Cheyenne Currently Married Correlation Chart
The statistical analysis conducted on geographies consisting of 287,965,636 people shows a mild negative correlation between the proportion of Haitians and percentage of population currently married in the United States with a correlation coefficient (R) of -0.332 and weighted average of 41.3%. Similarly, the statistical analysis conducted on geographies consisting of 80,721,070 people shows a mild negative correlation between the proportion of Cheyenne and percentage of population currently married in the United States with a correlation coefficient (R) of -0.337 and weighted average of 42.2%, a difference of 2.4%.
Currently Married Correlation Summary
| Measurement | Haitian | Cheyenne |
| Minimum | 28.3% | 23.7% |
| Maximum | 46.5% | 62.3% |
| Range | 18.2% | 38.6% |
| Mean | 39.6% | 45.6% |
| Median | 40.6% | 46.1% |
| Interquartile 25% (IQ1) | 36.7% | 41.6% |
| Interquartile 75% (IQ3) | 42.8% | 51.4% |
| Interquartile Range (IQR) | 6.1% | 9.8% |
| Standard Deviation (Sample) | 3.9% | 10.3% |
| Standard Deviation (Population) | 3.9% | 10.2% |
Demographics Similar to Haitians and Cheyenne by Currently Married
In terms of currently married, the demographic groups most similar to Haitians are Immigrants from Caribbean (41.3%, a difference of 0.020%), Inupiat (41.3%, a difference of 0.080%), West Indian (41.3%, a difference of 0.17%), Jamaican (41.4%, a difference of 0.24%), and Somali (41.5%, a difference of 0.53%). Similarly, the demographic groups most similar to Cheyenne are Immigrants from Honduras (42.2%, a difference of 0.090%), Liberian (42.2%, a difference of 0.12%), Belizean (42.2%, a difference of 0.22%), Immigrants from Yemen (42.1%, a difference of 0.46%), and Immigrants from Zaire (42.0%, a difference of 0.71%).
| Demographics | Rating | Rank | Currently Married |
| Cheyenne | 0.0 /100 | #297 | Tragic 42.2% |
| Immigrants | Honduras | 0.0 /100 | #298 | Tragic 42.2% |
| Liberians | 0.0 /100 | #299 | Tragic 42.2% |
| Belizeans | 0.0 /100 | #300 | Tragic 42.2% |
| Immigrants | Yemen | 0.0 /100 | #301 | Tragic 42.1% |
| Immigrants | Zaire | 0.0 /100 | #302 | Tragic 42.0% |
| Sioux | 0.0 /100 | #303 | Tragic 41.9% |
| Immigrants | Bahamas | 0.0 /100 | #304 | Tragic 41.9% |
| Immigrants | Trinidad and Tobago | 0.0 /100 | #305 | Tragic 41.9% |
| Immigrants | Guyana | 0.0 /100 | #306 | Tragic 41.9% |
| Africans | 0.0 /100 | #307 | Tragic 41.8% |
| Immigrants | Belize | 0.0 /100 | #308 | Tragic 41.8% |
| Immigrants | Liberia | 0.0 /100 | #309 | Tragic 41.8% |
| Guyanese | 0.0 /100 | #310 | Tragic 41.6% |
| Trinidadians and Tobagonians | 0.0 /100 | #311 | Tragic 41.5% |
| Somalis | 0.0 /100 | #312 | Tragic 41.5% |
| Jamaicans | 0.0 /100 | #313 | Tragic 41.4% |
| West Indians | 0.0 /100 | #314 | Tragic 41.3% |
| Inupiat | 0.0 /100 | #315 | Tragic 41.3% |
| Immigrants | Caribbean | 0.0 /100 | #316 | Tragic 41.3% |
| Haitians | 0.0 /100 | #317 | Tragic 41.3% |