Immigrants from Europe vs Cheyenne Currently Married
COMPARE
Immigrants from Europe
Cheyenne
Currently Married
Currently Married Comparison
Immigrants from Europe
Cheyenne
48.1%
CURRENTLY MARRIED
96.9/ 100
METRIC RATING
82nd/ 347
METRIC RANK
42.2%
CURRENTLY MARRIED
0.0/ 100
METRIC RATING
297th/ 347
METRIC RANK
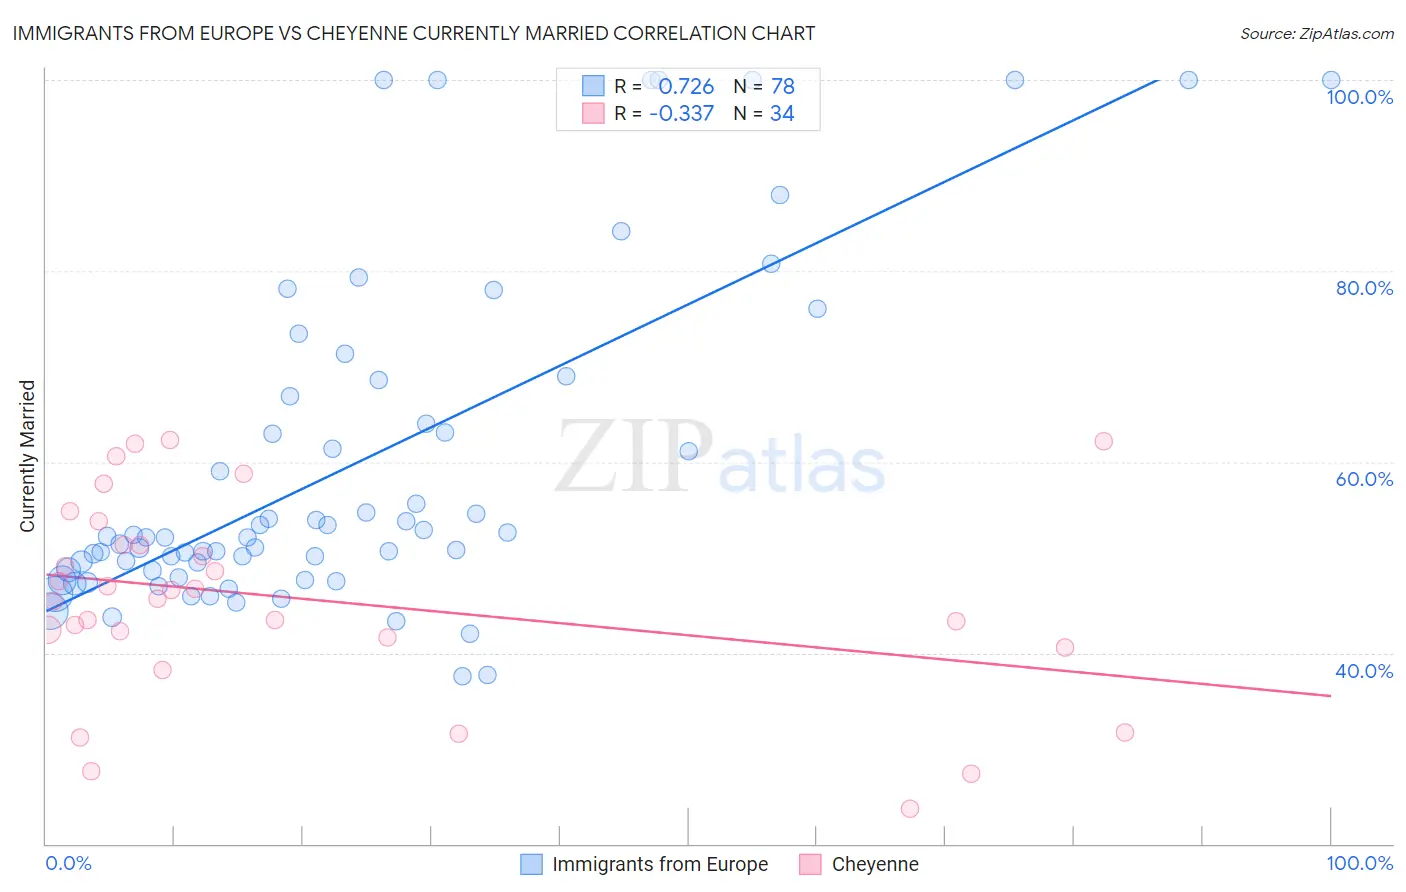
Immigrants from Europe vs Cheyenne Currently Married Correlation Chart
The statistical analysis conducted on geographies consisting of 547,318,007 people shows a strong positive correlation between the proportion of Immigrants from Europe and percentage of population currently married in the United States with a correlation coefficient (R) of 0.726 and weighted average of 48.1%. Similarly, the statistical analysis conducted on geographies consisting of 80,721,070 people shows a mild negative correlation between the proportion of Cheyenne and percentage of population currently married in the United States with a correlation coefficient (R) of -0.337 and weighted average of 42.2%, a difference of 13.9%.
Currently Married Correlation Summary
| Measurement | Immigrants from Europe | Cheyenne |
| Minimum | 37.5% | 23.7% |
| Maximum | 100.0% | 62.3% |
| Range | 62.5% | 38.6% |
| Mean | 59.6% | 45.6% |
| Median | 52.1% | 46.1% |
| Interquartile 25% (IQ1) | 48.6% | 41.6% |
| Interquartile 75% (IQ3) | 66.9% | 51.4% |
| Interquartile Range (IQR) | 18.3% | 9.8% |
| Standard Deviation (Sample) | 17.4% | 10.3% |
| Standard Deviation (Population) | 17.3% | 10.2% |
Similar Demographics by Currently Married
Demographics Similar to Immigrants from Europe by Currently Married
In terms of currently married, the demographic groups most similar to Immigrants from Europe are Immigrants from Sri Lanka (48.1%, a difference of 0.0%), Immigrants from Poland (48.1%, a difference of 0.010%), Bolivian (48.1%, a difference of 0.010%), Immigrants from Israel (48.1%, a difference of 0.010%), and Immigrants from South Africa (48.1%, a difference of 0.040%).
| Demographics | Rating | Rank | Currently Married |
| Immigrants | Belarus | 97.2 /100 | #75 | Exceptional 48.1% |
| Basques | 97.2 /100 | #76 | Exceptional 48.1% |
| Slovenes | 97.1 /100 | #77 | Exceptional 48.1% |
| Immigrants | Belgium | 97.1 /100 | #78 | Exceptional 48.1% |
| Immigrants | South Africa | 97.0 /100 | #79 | Exceptional 48.1% |
| Immigrants | Poland | 96.9 /100 | #80 | Exceptional 48.1% |
| Immigrants | Sri Lanka | 96.9 /100 | #81 | Exceptional 48.1% |
| Immigrants | Europe | 96.9 /100 | #82 | Exceptional 48.1% |
| Bolivians | 96.9 /100 | #83 | Exceptional 48.1% |
| Immigrants | Israel | 96.9 /100 | #84 | Exceptional 48.1% |
| French Canadians | 96.3 /100 | #85 | Exceptional 48.0% |
| Immigrants | Japan | 96.2 /100 | #86 | Exceptional 48.0% |
| Jordanians | 96.2 /100 | #87 | Exceptional 48.0% |
| Immigrants | Eastern Europe | 96.1 /100 | #88 | Exceptional 48.0% |
| Indians (Asian) | 95.8 /100 | #89 | Exceptional 48.0% |
Demographics Similar to Cheyenne by Currently Married
In terms of currently married, the demographic groups most similar to Cheyenne are Immigrants from Honduras (42.2%, a difference of 0.090%), Menominee (42.3%, a difference of 0.11%), Liberian (42.2%, a difference of 0.12%), Belizean (42.2%, a difference of 0.22%), and Immigrants from Western Africa (42.4%, a difference of 0.31%).
| Demographics | Rating | Rank | Currently Married |
| Immigrants | Ghana | 0.0 /100 | #290 | Tragic 42.7% |
| Immigrants | Guatemala | 0.0 /100 | #291 | Tragic 42.6% |
| Sub-Saharan Africans | 0.0 /100 | #292 | Tragic 42.6% |
| Yuman | 0.0 /100 | #293 | Tragic 42.6% |
| Hondurans | 0.0 /100 | #294 | Tragic 42.5% |
| Immigrants | Western Africa | 0.0 /100 | #295 | Tragic 42.4% |
| Menominee | 0.0 /100 | #296 | Tragic 42.3% |
| Cheyenne | 0.0 /100 | #297 | Tragic 42.2% |
| Immigrants | Honduras | 0.0 /100 | #298 | Tragic 42.2% |
| Liberians | 0.0 /100 | #299 | Tragic 42.2% |
| Belizeans | 0.0 /100 | #300 | Tragic 42.2% |
| Immigrants | Yemen | 0.0 /100 | #301 | Tragic 42.1% |
| Immigrants | Zaire | 0.0 /100 | #302 | Tragic 42.0% |
| Sioux | 0.0 /100 | #303 | Tragic 41.9% |
| Immigrants | Bahamas | 0.0 /100 | #304 | Tragic 41.9% |