Italian vs Cheyenne Currently Married
COMPARE
Italian
Cheyenne
Currently Married
Currently Married Comparison
Italians
Cheyenne
48.8%
CURRENTLY MARRIED
99.4/ 100
METRIC RATING
36th/ 347
METRIC RANK
42.2%
CURRENTLY MARRIED
0.0/ 100
METRIC RATING
297th/ 347
METRIC RANK
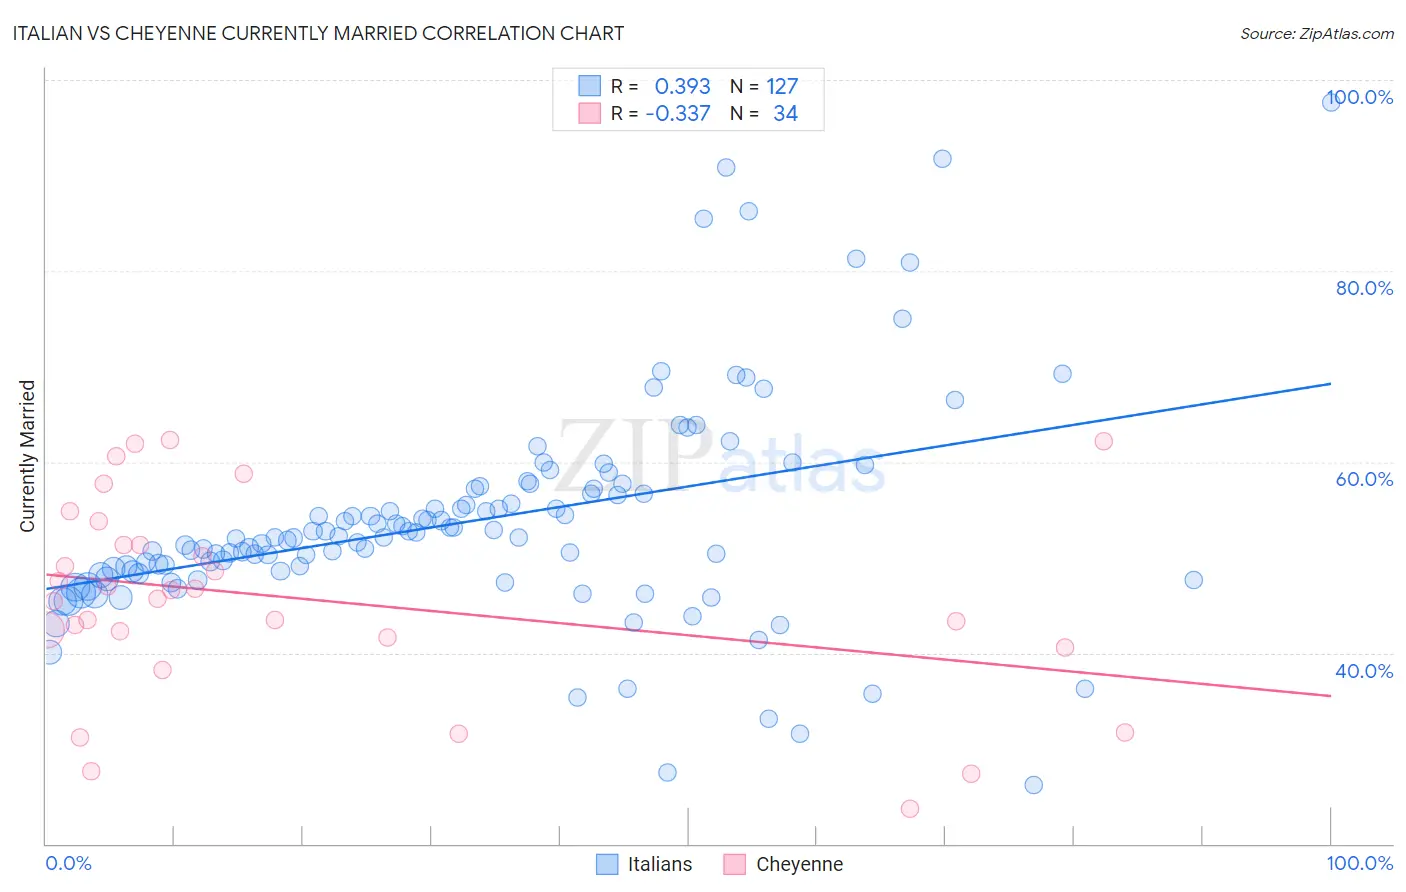
Italian vs Cheyenne Currently Married Correlation Chart
The statistical analysis conducted on geographies consisting of 574,980,657 people shows a mild positive correlation between the proportion of Italians and percentage of population currently married in the United States with a correlation coefficient (R) of 0.393 and weighted average of 48.8%. Similarly, the statistical analysis conducted on geographies consisting of 80,721,070 people shows a mild negative correlation between the proportion of Cheyenne and percentage of population currently married in the United States with a correlation coefficient (R) of -0.337 and weighted average of 42.2%, a difference of 15.6%.
Currently Married Correlation Summary
| Measurement | Italian | Cheyenne |
| Minimum | 26.2% | 23.7% |
| Maximum | 97.6% | 62.3% |
| Range | 71.5% | 38.6% |
| Mean | 53.8% | 45.6% |
| Median | 52.1% | 46.1% |
| Interquartile 25% (IQ1) | 48.3% | 41.6% |
| Interquartile 75% (IQ3) | 57.2% | 51.4% |
| Interquartile Range (IQR) | 8.8% | 9.8% |
| Standard Deviation (Sample) | 11.5% | 10.3% |
| Standard Deviation (Population) | 11.5% | 10.2% |
Similar Demographics by Currently Married
Demographics Similar to Italians by Currently Married
In terms of currently married, the demographic groups most similar to Italians are Hungarian (48.8%, a difference of 0.0%), Immigrants from Northern Europe (48.8%, a difference of 0.010%), Immigrants from Lithuania (48.8%, a difference of 0.030%), Czechoslovakian (48.8%, a difference of 0.040%), and British (48.8%, a difference of 0.070%).
| Demographics | Rating | Rank | Currently Married |
| Croatians | 99.5 /100 | #29 | Exceptional 48.9% |
| Eastern Europeans | 99.5 /100 | #30 | Exceptional 48.9% |
| Poles | 99.5 /100 | #31 | Exceptional 48.9% |
| Immigrants | Hong Kong | 99.5 /100 | #32 | Exceptional 48.9% |
| Irish | 99.5 /100 | #33 | Exceptional 48.9% |
| Immigrants | Lithuania | 99.4 /100 | #34 | Exceptional 48.8% |
| Immigrants | Northern Europe | 99.4 /100 | #35 | Exceptional 48.8% |
| Italians | 99.4 /100 | #36 | Exceptional 48.8% |
| Hungarians | 99.4 /100 | #37 | Exceptional 48.8% |
| Czechoslovakians | 99.4 /100 | #38 | Exceptional 48.8% |
| British | 99.4 /100 | #39 | Exceptional 48.8% |
| Immigrants | Canada | 99.4 /100 | #40 | Exceptional 48.8% |
| Greeks | 99.3 /100 | #41 | Exceptional 48.8% |
| Finns | 99.3 /100 | #42 | Exceptional 48.8% |
| Scotch-Irish | 99.3 /100 | #43 | Exceptional 48.7% |
Demographics Similar to Cheyenne by Currently Married
In terms of currently married, the demographic groups most similar to Cheyenne are Immigrants from Honduras (42.2%, a difference of 0.090%), Menominee (42.3%, a difference of 0.11%), Liberian (42.2%, a difference of 0.12%), Belizean (42.2%, a difference of 0.22%), and Immigrants from Western Africa (42.4%, a difference of 0.31%).
| Demographics | Rating | Rank | Currently Married |
| Immigrants | Ghana | 0.0 /100 | #290 | Tragic 42.7% |
| Immigrants | Guatemala | 0.0 /100 | #291 | Tragic 42.6% |
| Sub-Saharan Africans | 0.0 /100 | #292 | Tragic 42.6% |
| Yuman | 0.0 /100 | #293 | Tragic 42.6% |
| Hondurans | 0.0 /100 | #294 | Tragic 42.5% |
| Immigrants | Western Africa | 0.0 /100 | #295 | Tragic 42.4% |
| Menominee | 0.0 /100 | #296 | Tragic 42.3% |
| Cheyenne | 0.0 /100 | #297 | Tragic 42.2% |
| Immigrants | Honduras | 0.0 /100 | #298 | Tragic 42.2% |
| Liberians | 0.0 /100 | #299 | Tragic 42.2% |
| Belizeans | 0.0 /100 | #300 | Tragic 42.2% |
| Immigrants | Yemen | 0.0 /100 | #301 | Tragic 42.1% |
| Immigrants | Zaire | 0.0 /100 | #302 | Tragic 42.0% |
| Sioux | 0.0 /100 | #303 | Tragic 41.9% |
| Immigrants | Bahamas | 0.0 /100 | #304 | Tragic 41.9% |