Potawatomi vs Liberian Married-couple Households
COMPARE
Potawatomi
Liberian
Married-couple Households
Married-couple Households Comparison
Potawatomi
Liberians
45.7%
MARRIED-COUPLE HOUSEHOLDS
15.6/ 100
METRIC RATING
200th/ 347
METRIC RANK
40.7%
MARRIED-COUPLE HOUSEHOLDS
0.0/ 100
METRIC RATING
318th/ 347
METRIC RANK
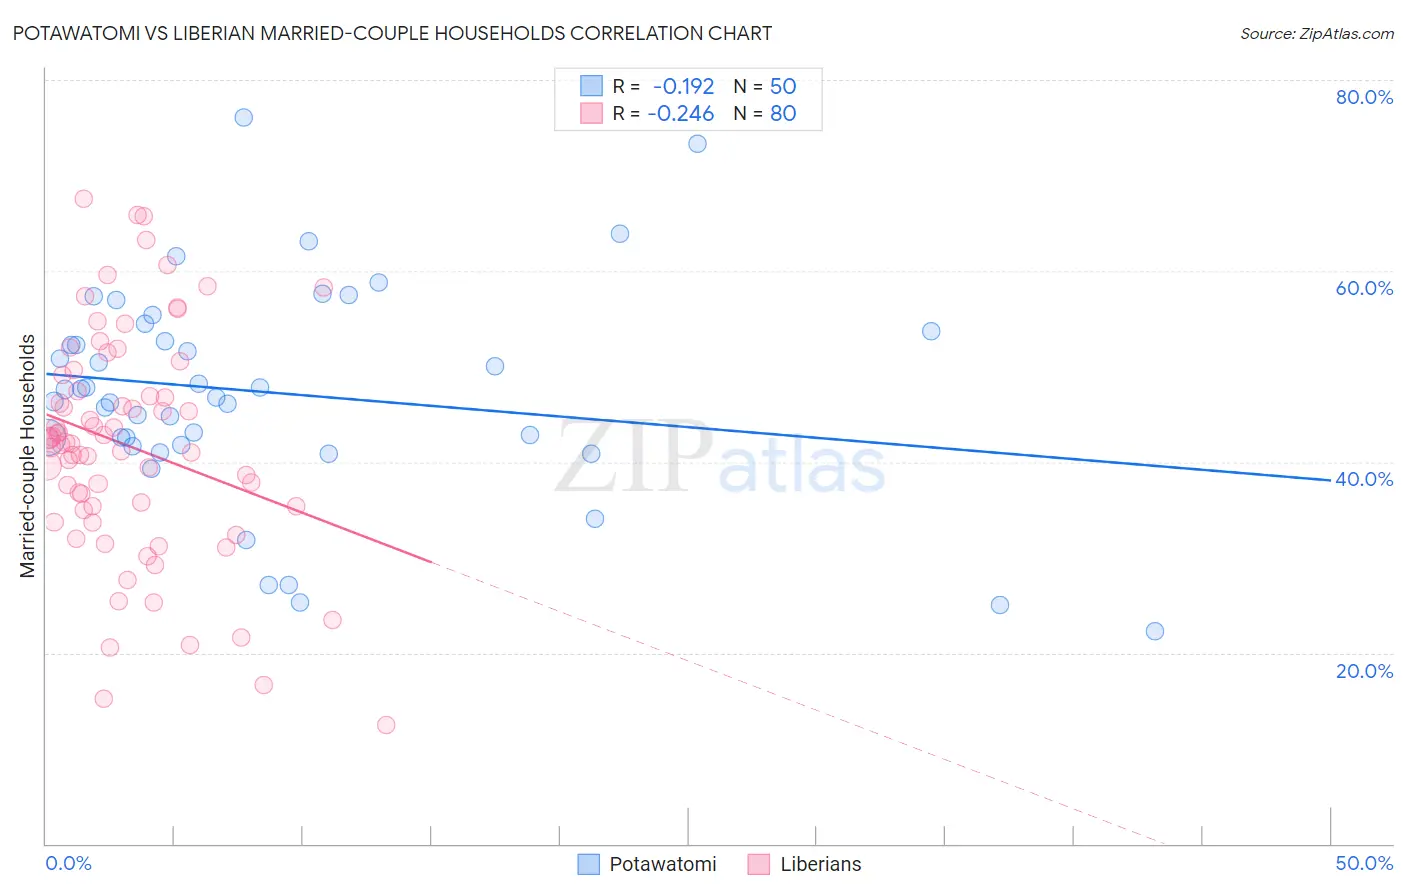
Potawatomi vs Liberian Married-couple Households Correlation Chart
The statistical analysis conducted on geographies consisting of 117,759,864 people shows a poor negative correlation between the proportion of Potawatomi and percentage of married-couple family households in the United States with a correlation coefficient (R) of -0.192 and weighted average of 45.7%. Similarly, the statistical analysis conducted on geographies consisting of 118,032,066 people shows a weak negative correlation between the proportion of Liberians and percentage of married-couple family households in the United States with a correlation coefficient (R) of -0.246 and weighted average of 40.7%, a difference of 12.4%.
Married-couple Households Correlation Summary
| Measurement | Potawatomi | Liberian |
| Minimum | 22.2% | 12.5% |
| Maximum | 76.1% | 67.6% |
| Range | 53.9% | 55.1% |
| Mean | 47.2% | 41.7% |
| Median | 47.1% | 42.0% |
| Interquartile 25% (IQ1) | 41.8% | 35.1% |
| Interquartile 75% (IQ3) | 53.7% | 48.2% |
| Interquartile Range (IQR) | 11.9% | 13.1% |
| Standard Deviation (Sample) | 11.3% | 11.9% |
| Standard Deviation (Population) | 11.2% | 11.8% |
Similar Demographics by Married-couple Households
Demographics Similar to Potawatomi by Married-couple Households
In terms of married-couple households, the demographic groups most similar to Potawatomi are Carpatho Rusyn (45.7%, a difference of 0.010%), Immigrants from Serbia (45.7%, a difference of 0.030%), Immigrants from Central America (45.7%, a difference of 0.11%), Alaska Native (45.6%, a difference of 0.20%), and Ottawa (45.8%, a difference of 0.25%).
| Demographics | Rating | Rank | Married-couple Households |
| Taiwanese | 23.4 /100 | #193 | Fair 45.9% |
| Mexican American Indians | 23.3 /100 | #194 | Fair 45.9% |
| Chickasaw | 22.7 /100 | #195 | Fair 45.9% |
| Immigrants | South America | 22.2 /100 | #196 | Fair 45.9% |
| Cambodians | 21.3 /100 | #197 | Fair 45.9% |
| Ottawa | 19.4 /100 | #198 | Poor 45.8% |
| Carpatho Rusyns | 15.7 /100 | #199 | Poor 45.7% |
| Potawatomi | 15.6 /100 | #200 | Poor 45.7% |
| Immigrants | Serbia | 15.2 /100 | #201 | Poor 45.7% |
| Immigrants | Central America | 14.2 /100 | #202 | Poor 45.7% |
| Alaska Natives | 13.0 /100 | #203 | Poor 45.6% |
| Aleuts | 12.5 /100 | #204 | Poor 45.6% |
| Nepalese | 11.9 /100 | #205 | Poor 45.6% |
| Uruguayans | 10.4 /100 | #206 | Poor 45.5% |
| Immigrants | France | 8.8 /100 | #207 | Tragic 45.4% |
Demographics Similar to Liberians by Married-couple Households
In terms of married-couple households, the demographic groups most similar to Liberians are Immigrants from Jamaica (40.7%, a difference of 0.010%), Immigrants from Caribbean (40.8%, a difference of 0.30%), Bahamian (40.5%, a difference of 0.35%), Trinidadian and Tobagonian (40.9%, a difference of 0.48%), and Jamaican (40.9%, a difference of 0.56%).
| Demographics | Rating | Rank | Married-couple Households |
| Colville | 0.0 /100 | #311 | Tragic 41.0% |
| Africans | 0.0 /100 | #312 | Tragic 40.9% |
| Immigrants | Haiti | 0.0 /100 | #313 | Tragic 40.9% |
| Jamaicans | 0.0 /100 | #314 | Tragic 40.9% |
| Trinidadians and Tobagonians | 0.0 /100 | #315 | Tragic 40.9% |
| Immigrants | Caribbean | 0.0 /100 | #316 | Tragic 40.8% |
| Immigrants | Jamaica | 0.0 /100 | #317 | Tragic 40.7% |
| Liberians | 0.0 /100 | #318 | Tragic 40.7% |
| Bahamians | 0.0 /100 | #319 | Tragic 40.5% |
| West Indians | 0.0 /100 | #320 | Tragic 40.3% |
| Immigrants | Liberia | 0.0 /100 | #321 | Tragic 40.3% |
| Immigrants | Zaire | 0.0 /100 | #322 | Tragic 40.1% |
| Puerto Ricans | 0.0 /100 | #323 | Tragic 40.1% |
| Navajo | 0.0 /100 | #324 | Tragic 40.1% |
| Pueblo | 0.0 /100 | #325 | Tragic 40.0% |