Potawatomi vs Liberian Unemployment Among Ages 45 to 54 years

COMPARE

Potawatomi
Race
Ancestry
AfghanAfricanAlaska NativeAlaskan AthabascanAlbanianAleutAlsatianAmericanApacheArabArapahoArgentineanArmenianAssyrian/Chaldean/SyriacAustralianAustrianBahamianBangladeshiBarbadianBasqueBelgianBelizeanBermudanBhutaneseBlackfeetBolivianBrazilianBritishBritish West IndianBulgarianBurmeseCajunCambodianCanadianCape VerdeanCarpatho RusynCelticCentral AmericanCentral American IndianCherokeeCheyenneChickasawChileanChineseChippewaChoctawColombianColvilleComancheCosta RicanCreeCreekCroatianCrowCubanCypriotCzechCzechoslovakianDanishDelawareDominicanDutchDutch West IndianEastern EuropeanEcuadorianEgyptianEnglishEstonianEthiopianEuropeanFijianFilipinoFinnishFrenchFrench American IndianFrench CanadianGermanGerman RussianGhanaianGreekGuamanian/ChamorroGuatemalanGuyaneseHaitianHmongHonduranHopiHoumaHungarianIcelanderIndian (Asian)IndonesianInupiatIranianIraqiIrishIroquoisIsraeliItalianJamaicanJapaneseJordanianKenyanKiowaKoreanLaotianLatvianLebaneseLithuanianLumbeeLuxembourgerMacedonianMalaysianMalteseMarshalleseMenomineeMexicanMexican American IndianMongolianMoroccanNative HawaiianNavajoNepaleseNew ZealanderNicaraguanNigerianNorthern EuropeanNorwegianOkinawanOsageOttawaPaiutePakistaniPalestinianPanamanianParaguayanPennsylvania GermanPeruvianPimaPolishPortuguesePotawatomiPuebloPuerto RicanPuget Sound SalishRomanianRussianSalvadoranSamoanScandinavianScotch-IrishScottishSeminoleSenegaleseSerbianShoshoneSierra LeoneanSiouxSlavicSlovakSloveneSomaliSouth AfricanSouth AmericanSouth American IndianSoviet UnionSpaniardSpanishSpanish AmericanSpanish American IndianSri LankanSubsaharan AfricanSudaneseSwedishSwissSyrianTaiwaneseThaiTlingit-HaidaTohono O'OdhamTonganTrinidadian and TobagonianTsimshianTurkishU.S. Virgin IslanderUgandanUkrainianUruguayanUteVenezuelanVietnameseWelshWest IndianYakamaYaquiYugoslavianYumanYup'ikZimbabwean
Immigration
NonimmigrantsImmigrantsAfghanistanAfricaAlbaniaArgentinaArmeniaAsiaAustraliaAustriaBahamasBangladeshBarbadosBelarusBelgiumBelizeBoliviaBosnia and HerzegovinaBrazilBulgariaBurma/MyanmarCabo VerdeCambodiaCameroonCanadaCaribbeanCentral AmericaChileChinaColombiaCongoCosta RicaCroatiaCubaCzechoslovakiaDenmarkDominicaDominican RepublicEastern AfricaEastern AsiaEastern EuropeEcuadorEgyptEl SalvadorEnglandEritreaEthiopiaEuropeFijiFranceGermanyGhanaGreeceGrenadaGuatemalaGuyanaHaitiHondurasHong KongHungaryIndiaIndonesiaIranIraqIrelandIsraelItalyJamaicaJapanJordanKazakhstanKenyaKoreaKuwaitLaosLatin AmericaLatviaLebanonLiberiaLithuaniaMalaysiaMexicoMicronesiaMiddle AfricaMoldovaMoroccoNepalNetherlandsNicaraguaNigeriaNorth AmericaNorth MacedoniaNorthern AfricaNorthern EuropeNorwayOceaniaPakistanPanamaPeruPhilippinesPolandPortugalRomaniaRussiaSaudi ArabiaScotlandSenegalSerbiaSierra LeoneSingaporeSomaliaSouth AfricaSouth AmericaSouth Central AsiaSouth Eastern AsiaSouthern EuropeSpainSri LankaSt. Vincent and the GrenadinesSudanSwedenSwitzerlandSyriaTaiwanThailandTrinidad and TobagoTurkeyUgandaUkraineUruguayUzbekistanVenezuelaVietnamWest IndiesWestern AfricaWestern AsiaWestern EuropeYemenZaireZimbabweAzores
Liberian
Race
Ancestry
AfghanAfricanAlaska NativeAlaskan AthabascanAlbanianAleutAlsatianAmericanApacheArabArapahoArgentineanArmenianAssyrian/Chaldean/SyriacAustralianAustrianBahamianBangladeshiBarbadianBasqueBelgianBelizeanBermudanBhutaneseBlackfeetBolivianBrazilianBritishBritish West IndianBulgarianBurmeseCajunCambodianCanadianCape VerdeanCarpatho RusynCelticCentral AmericanCentral American IndianCherokeeCheyenneChickasawChileanChineseChippewaChoctawColombianColvilleComancheCosta RicanCreeCreekCroatianCrowCubanCypriotCzechCzechoslovakianDanishDelawareDominicanDutchDutch West IndianEastern EuropeanEcuadorianEgyptianEnglishEstonianEthiopianEuropeanFijianFilipinoFinnishFrenchFrench American IndianFrench CanadianGermanGerman RussianGhanaianGreekGuamanian/ChamorroGuatemalanGuyaneseHaitianHmongHonduranHopiHoumaHungarianIcelanderIndian (Asian)IndonesianInupiatIranianIraqiIrishIroquoisIsraeliItalianJamaicanJapaneseJordanianKenyanKiowaKoreanLaotianLatvianLebaneseLiberianLithuanianLumbeeLuxembourgerMacedonianMalaysianMalteseMarshalleseMenomineeMexicanMexican American IndianMongolianMoroccanNative HawaiianNavajoNepaleseNew ZealanderNicaraguanNigerianNorthern EuropeanNorwegianOkinawanOsageOttawaPaiutePakistaniPalestinianPanamanianParaguayanPennsylvania GermanPeruvianPimaPolishPortuguesePuebloPuerto RicanPuget Sound SalishRomanianRussianSalvadoranSamoanScandinavianScotch-IrishScottishSeminoleSenegaleseSerbianShoshoneSierra LeoneanSiouxSlavicSlovakSloveneSomaliSouth AfricanSouth AmericanSouth American IndianSoviet UnionSpaniardSpanishSpanish AmericanSpanish American IndianSri LankanSubsaharan AfricanSudaneseSwedishSwissSyrianTaiwaneseThaiTlingit-HaidaTohono O'OdhamTonganTrinidadian and TobagonianTsimshianTurkishU.S. Virgin IslanderUgandanUkrainianUruguayanUteVenezuelanVietnameseWelshWest IndianYakamaYaquiYugoslavianYumanYup'ikZimbabwean
Immigration
NonimmigrantsImmigrantsAfghanistanAfricaAlbaniaArgentinaArmeniaAsiaAustraliaAustriaBahamasBangladeshBarbadosBelarusBelgiumBelizeBoliviaBosnia and HerzegovinaBrazilBulgariaBurma/MyanmarCabo VerdeCambodiaCameroonCanadaCaribbeanCentral AmericaChileChinaColombiaCongoCosta RicaCroatiaCubaCzechoslovakiaDenmarkDominicaDominican RepublicEastern AfricaEastern AsiaEastern EuropeEcuadorEgyptEl SalvadorEnglandEritreaEthiopiaEuropeFijiFranceGermanyGhanaGreeceGrenadaGuatemalaGuyanaHaitiHondurasHong KongHungaryIndiaIndonesiaIranIraqIrelandIsraelItalyJamaicaJapanJordanKazakhstanKenyaKoreaKuwaitLaosLatin AmericaLatviaLebanonLiberiaLithuaniaMalaysiaMexicoMicronesiaMiddle AfricaMoldovaMoroccoNepalNetherlandsNicaraguaNigeriaNorth AmericaNorth MacedoniaNorthern AfricaNorthern EuropeNorwayOceaniaPakistanPanamaPeruPhilippinesPolandPortugalRomaniaRussiaSaudi ArabiaScotlandSenegalSerbiaSierra LeoneSingaporeSomaliaSouth AfricaSouth AmericaSouth Central AsiaSouth Eastern AsiaSouthern EuropeSpainSri LankaSt. Vincent and the GrenadinesSudanSwedenSwitzerlandSyriaTaiwanThailandTrinidad and TobagoTurkeyUgandaUkraineUruguayUzbekistanVenezuelaVietnamWest IndiesWestern AfricaWestern AsiaWestern EuropeYemenZaireZimbabweAzores
Unemployment Among Ages 45 to 54 years
Income
Poverty
Unemployment
Labor Participation
Family Structure
Vehicle Availability
Education Level
Disability

Unemployment Among Ages 45 to 54 years Comparison

Potawatomi

Liberians

Tragic
Poor
4.7%
UNEMPLOYMENT AMONG AGES 45 TO 54 YEARS
5.7/ 100
METRIC RATING
223rd/ 347
METRIC RANK
4.6%
UNEMPLOYMENT AMONG AGES 45 TO 54 YEARS
18.7/ 100
METRIC RATING
203rd/ 347
METRIC RANK

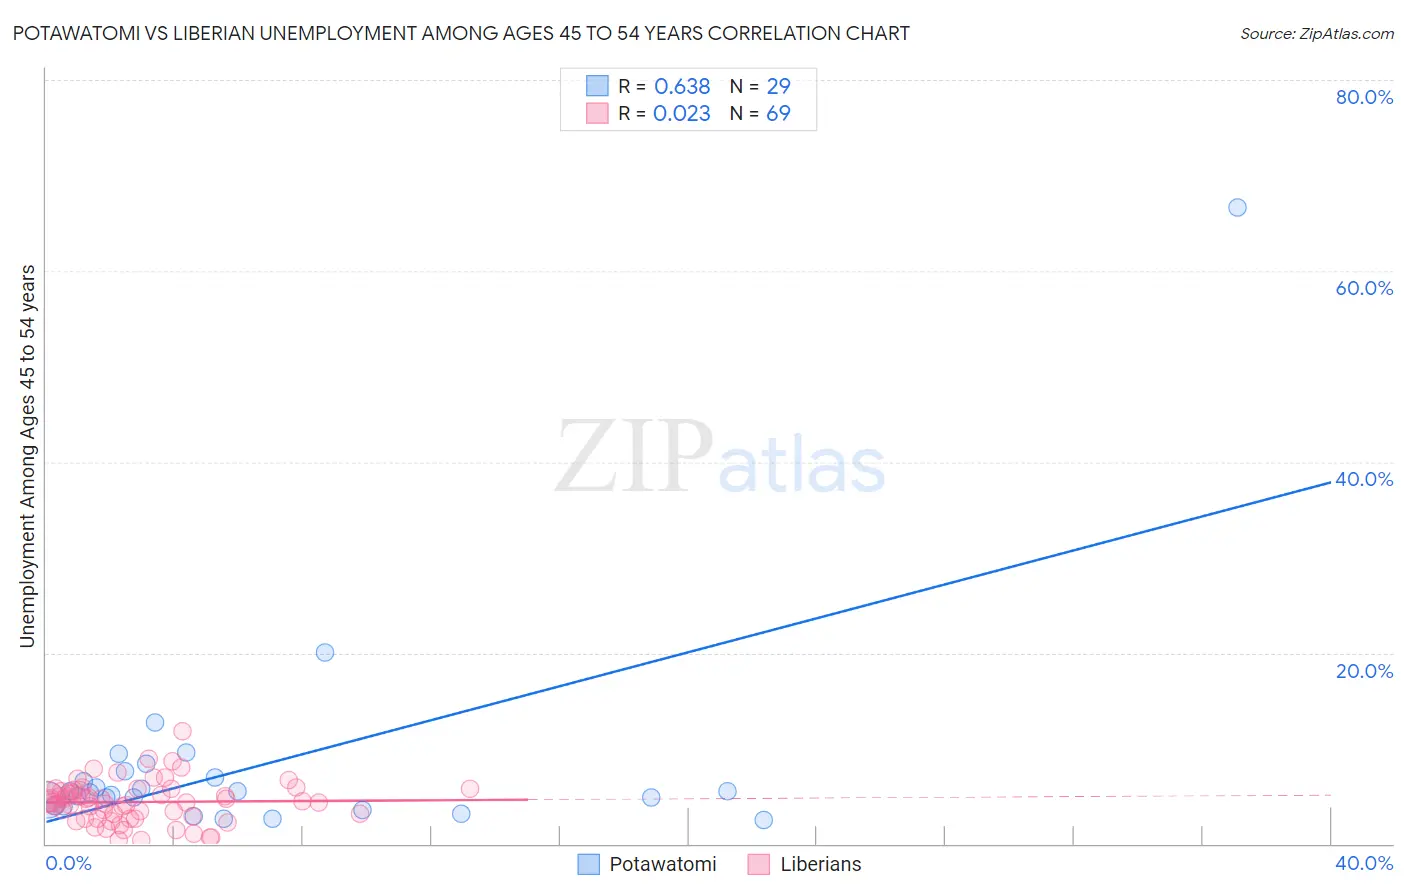
Potawatomi vs Liberian Unemployment Among Ages 45 to 54 years Correlation Chart

The statistical analysis conducted on geographies consisting of 116,004,554 people shows a significant positive correlation between the proportion of Potawatomi and unemployment rate among population between the ages 45 and 54 in the United States with a correlation coefficient (R) of 0.638 and weighted average of 4.7%. Similarly, the statistical analysis conducted on geographies consisting of 117,212,866 people shows no correlation between the proportion of Liberians and unemployment rate among population between the ages 45 and 54 in the United States with a correlation coefficient (R) of 0.023 and weighted average of 4.6%, a difference of 1.5%.
Potawatomi vs Liberian Unemployment Among Ages 45 to 54 years

Unemployment Among Ages 45 to 54 years Correlation Summary

MeasurementPotawatomiLiberian
Minimum2.5%0.40%
Maximum66.7%11.8%
Range64.2%11.4%
Mean8.1%4.4%
Median5.4%4.4%
Interquartile 25% (IQ1)4.0%2.8%
Interquartile 75% (IQ3)7.3%5.6%
Interquartile Range (IQR)3.3%2.8%
Standard Deviation (Sample)11.8%2.2%
Standard Deviation (Population)11.6%2.1%

Demographics Similar to Potawatomi and Liberians by Unemployment Among Ages 45 to 54 years

In terms of unemployment among ages 45 to 54 years, the demographic groups most similar to Potawatomi are Immigrants from Southern Europe (4.7%, a difference of 0.060%), Choctaw (4.7%, a difference of 0.090%), Guamanian/Chamorro (4.7%, a difference of 0.22%), Nigerian (4.7%, a difference of 0.24%), and Immigrants from Uganda (4.7%, a difference of 0.28%). Similarly, the demographic groups most similar to Liberians are Immigrants from Morocco (4.6%, a difference of 0.15%), Immigrants from Greece (4.6%, a difference of 0.20%), Immigrants from Switzerland (4.6%, a difference of 0.40%), Arab (4.6%, a difference of 0.42%), and Immigrants from Africa (4.6%, a difference of 0.44%).
DemographicsRating | RankUnemployment Among Ages 45 to 54 years
Liberians
18.7
/100
|
#203
Poor
4.6%
Immigrants | Morocco
16.8
/100
|
#204
Poor
4.6%
Immigrants | Greece
16.2
/100
|
#205
Poor
4.6%
Immigrants | Switzerland
14.0
/100
|
#206
Poor
4.6%
Arabs
13.7
/100
|
#207
Poor
4.6%
Immigrants | Africa
13.6
/100
|
#208
Poor
4.6%
Immigrants | Nigeria
13.3
/100
|
#209
Poor
4.6%
Immigrants | South America
12.2
/100
|
#210
Poor
4.6%
Creek
11.9
/100
|
#211
Poor
4.6%
Immigrants | Iran
11.5
/100
|
#212
Poor
4.6%
Panamanians
10.7
/100
|
#213
Poor
4.6%
Cherokee
10.6
/100
|
#214
Poor
4.6%
Immigrants | Panama
10.4
/100
|
#215
Poor
4.6%
Lumbee
9.2
/100
|
#216
Tragic
4.6%
Immigrants | Cambodia
7.4
/100
|
#217
Tragic
4.7%
Immigrants | Uganda
7.1
/100
|
#218
Tragic
4.7%
Nigerians
7.0
/100
|
#219
Tragic
4.7%
Guamanians/Chamorros
6.8
/100
|
#220
Tragic
4.7%
Choctaw
6.1
/100
|
#221
Tragic
4.7%
Immigrants | Southern Europe
6.0
/100
|
#222
Tragic
4.7%
Potawatomi
5.7
/100
|
#223
Tragic
4.7%