Potawatomi vs Liberian Family Households
COMPARE
Potawatomi
Liberian
Family Households
Family Households Comparison
Potawatomi
Liberians
63.3%
FAMILY HOUSEHOLDS
1.0/ 100
METRIC RATING
255th/ 347
METRIC RANK
62.0%
FAMILY HOUSEHOLDS
0.0/ 100
METRIC RATING
313th/ 347
METRIC RANK
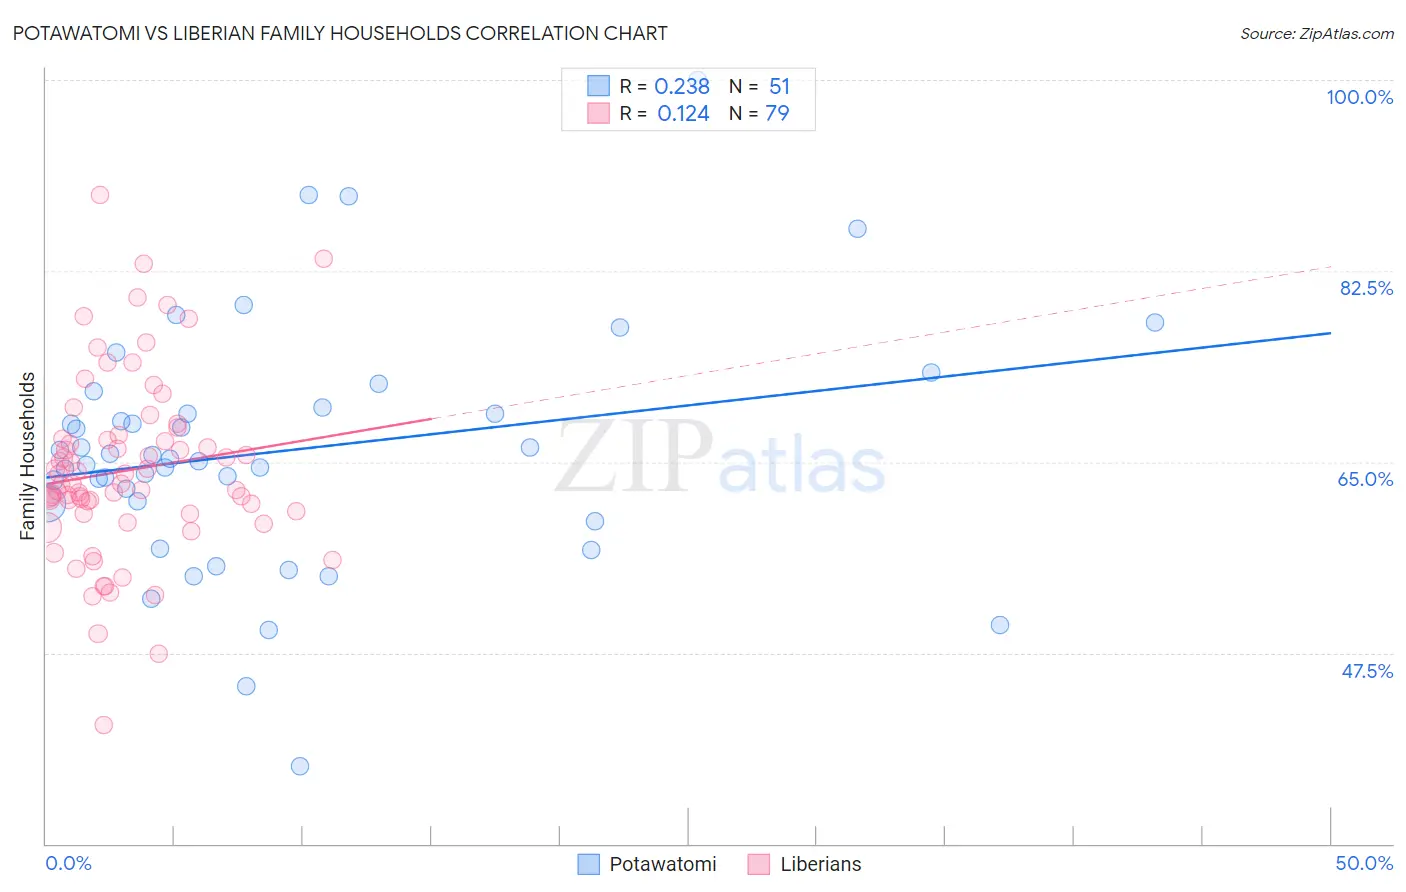
Potawatomi vs Liberian Family Households Correlation Chart
The statistical analysis conducted on geographies consisting of 117,759,902 people shows a weak positive correlation between the proportion of Potawatomi and percentage of family households in the United States with a correlation coefficient (R) of 0.238 and weighted average of 63.3%. Similarly, the statistical analysis conducted on geographies consisting of 118,040,608 people shows a poor positive correlation between the proportion of Liberians and percentage of family households in the United States with a correlation coefficient (R) of 0.124 and weighted average of 62.0%, a difference of 2.1%.
Family Households Correlation Summary
| Measurement | Potawatomi | Liberian |
| Minimum | 37.1% | 40.9% |
| Maximum | 100.0% | 89.4% |
| Range | 62.9% | 48.5% |
| Mean | 66.1% | 64.2% |
| Median | 65.3% | 63.0% |
| Interquartile 25% (IQ1) | 61.2% | 60.3% |
| Interquartile 75% (IQ3) | 70.0% | 67.1% |
| Interquartile Range (IQR) | 8.8% | 6.8% |
| Standard Deviation (Sample) | 11.3% | 8.3% |
| Standard Deviation (Population) | 11.2% | 8.3% |
Similar Demographics by Family Households
Demographics Similar to Potawatomi by Family Households
In terms of family households, the demographic groups most similar to Potawatomi are Slovak (63.3%, a difference of 0.020%), Luxembourger (63.3%, a difference of 0.020%), Immigrants from Dominican Republic (63.3%, a difference of 0.030%), Bahamian (63.3%, a difference of 0.050%), and Icelander (63.3%, a difference of 0.060%).
| Demographics | Rating | Rank | Family Households |
| Dominicans | 1.5 /100 | #248 | Tragic 63.4% |
| Russians | 1.4 /100 | #249 | Tragic 63.4% |
| Immigrants | Japan | 1.4 /100 | #250 | Tragic 63.4% |
| Taiwanese | 1.2 /100 | #251 | Tragic 63.3% |
| Bahamians | 1.1 /100 | #252 | Tragic 63.3% |
| Immigrants | Dominican Republic | 1.0 /100 | #253 | Tragic 63.3% |
| Slovaks | 1.0 /100 | #254 | Tragic 63.3% |
| Potawatomi | 1.0 /100 | #255 | Tragic 63.3% |
| Luxembourgers | 0.9 /100 | #256 | Tragic 63.3% |
| Icelanders | 0.8 /100 | #257 | Tragic 63.3% |
| Immigrants | Barbados | 0.7 /100 | #258 | Tragic 63.2% |
| Immigrants | Western Europe | 0.6 /100 | #259 | Tragic 63.2% |
| Cypriots | 0.6 /100 | #260 | Tragic 63.2% |
| Immigrants | Russia | 0.6 /100 | #261 | Tragic 63.2% |
| Immigrants | Ireland | 0.6 /100 | #262 | Tragic 63.2% |
Demographics Similar to Liberians by Family Households
In terms of family households, the demographic groups most similar to Liberians are Immigrants from Latvia (62.0%, a difference of 0.010%), Immigrants from Morocco (62.0%, a difference of 0.050%), Immigrants from Cabo Verde (61.9%, a difference of 0.050%), Immigrants from Liberia (62.0%, a difference of 0.080%), and Moroccan (61.9%, a difference of 0.090%).
| Demographics | Rating | Rank | Family Households |
| Africans | 0.0 /100 | #306 | Tragic 62.1% |
| Immigrants | Norway | 0.0 /100 | #307 | Tragic 62.1% |
| Chippewa | 0.0 /100 | #308 | Tragic 62.1% |
| Sub-Saharan Africans | 0.0 /100 | #309 | Tragic 62.1% |
| Immigrants | Liberia | 0.0 /100 | #310 | Tragic 62.0% |
| Immigrants | Morocco | 0.0 /100 | #311 | Tragic 62.0% |
| Immigrants | Latvia | 0.0 /100 | #312 | Tragic 62.0% |
| Liberians | 0.0 /100 | #313 | Tragic 62.0% |
| Immigrants | Cabo Verde | 0.0 /100 | #314 | Tragic 61.9% |
| Moroccans | 0.0 /100 | #315 | Tragic 61.9% |
| Immigrants | Middle Africa | 0.0 /100 | #316 | Tragic 61.9% |
| Immigrants | Bosnia and Herzegovina | 0.0 /100 | #317 | Tragic 61.9% |
| Alaskan Athabascans | 0.0 /100 | #318 | Tragic 61.8% |
| Cape Verdeans | 0.0 /100 | #319 | Tragic 61.8% |
| Ugandans | 0.0 /100 | #320 | Tragic 61.7% |