Portuguese vs Cree Currently Married
COMPARE
Portuguese
Cree
Currently Married
Currently Married Comparison
Portuguese
Cree
47.3%
CURRENTLY MARRIED
84.2/ 100
METRIC RATING
128th/ 347
METRIC RANK
44.9%
CURRENTLY MARRIED
1.7/ 100
METRIC RATING
229th/ 347
METRIC RANK
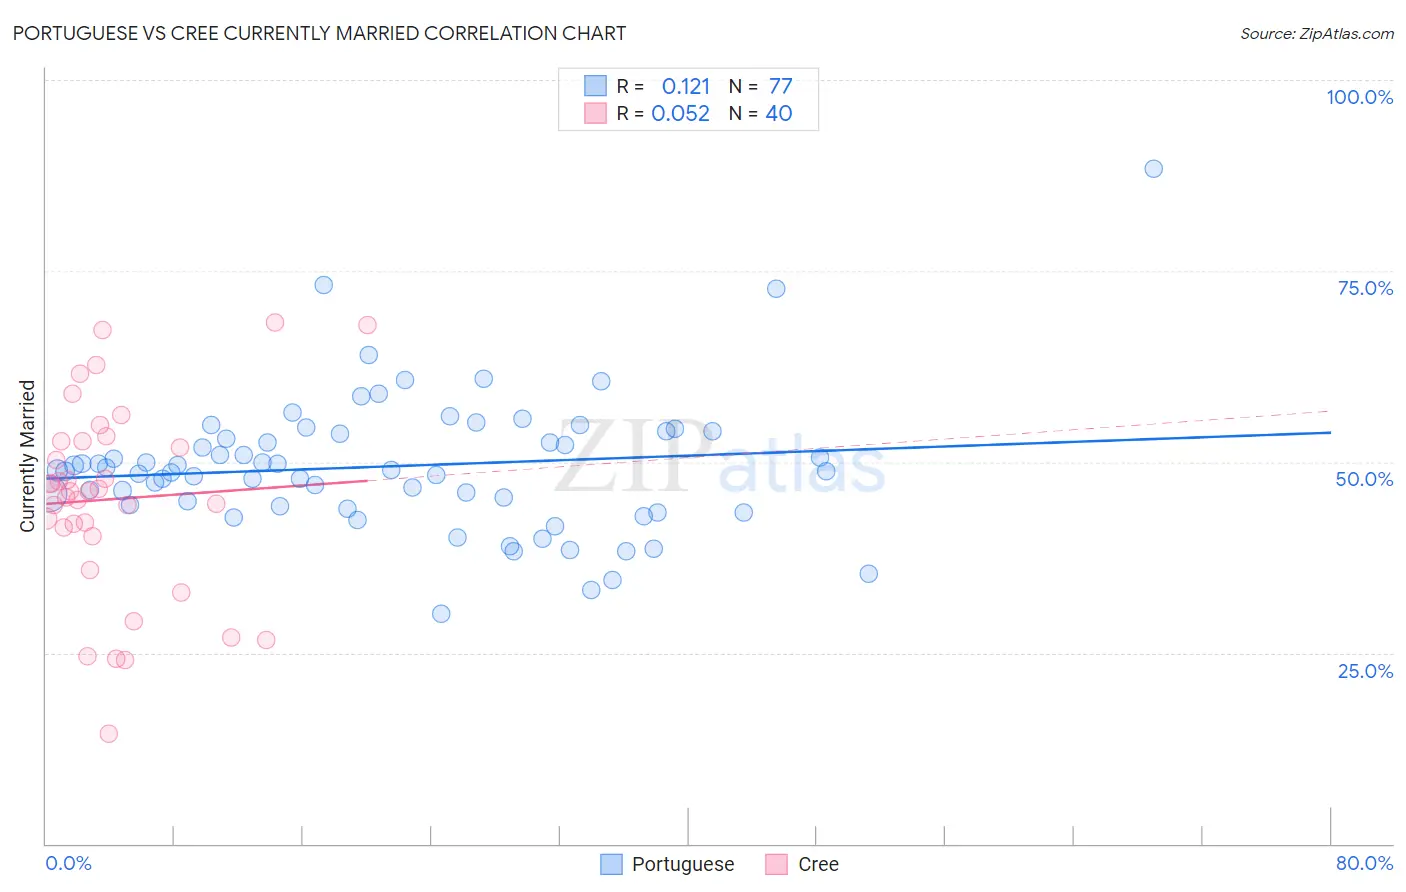
Portuguese vs Cree Currently Married Correlation Chart
The statistical analysis conducted on geographies consisting of 450,286,612 people shows a poor positive correlation between the proportion of Portuguese and percentage of population currently married in the United States with a correlation coefficient (R) of 0.121 and weighted average of 47.3%. Similarly, the statistical analysis conducted on geographies consisting of 76,211,685 people shows a slight positive correlation between the proportion of Cree and percentage of population currently married in the United States with a correlation coefficient (R) of 0.052 and weighted average of 44.9%, a difference of 5.4%.
Currently Married Correlation Summary
| Measurement | Portuguese | Cree |
| Minimum | 30.1% | 14.4% |
| Maximum | 88.3% | 68.3% |
| Range | 58.2% | 53.9% |
| Mean | 49.4% | 45.1% |
| Median | 48.9% | 46.1% |
| Interquartile 25% (IQ1) | 44.3% | 40.8% |
| Interquartile 75% (IQ3) | 53.9% | 52.6% |
| Interquartile Range (IQR) | 9.5% | 11.8% |
| Standard Deviation (Sample) | 8.9% | 12.7% |
| Standard Deviation (Population) | 8.9% | 12.5% |
Similar Demographics by Currently Married
Demographics Similar to Portuguese by Currently Married
In terms of currently married, the demographic groups most similar to Portuguese are New Zealander (47.4%, a difference of 0.040%), Immigrants from Jordan (47.4%, a difference of 0.050%), Sri Lankan (47.3%, a difference of 0.060%), Okinawan (47.4%, a difference of 0.080%), and Immigrants from Iraq (47.3%, a difference of 0.090%).
| Demographics | Rating | Rank | Currently Married |
| Immigrants | Croatia | 88.6 /100 | #121 | Excellent 47.5% |
| Osage | 87.9 /100 | #122 | Excellent 47.5% |
| Immigrants | Kazakhstan | 87.2 /100 | #123 | Excellent 47.4% |
| Laotians | 86.6 /100 | #124 | Excellent 47.4% |
| Okinawans | 85.3 /100 | #125 | Excellent 47.4% |
| Immigrants | Jordan | 84.9 /100 | #126 | Excellent 47.4% |
| New Zealanders | 84.9 /100 | #127 | Excellent 47.4% |
| Portuguese | 84.2 /100 | #128 | Excellent 47.3% |
| Sri Lankans | 83.2 /100 | #129 | Excellent 47.3% |
| Immigrants | Iraq | 82.8 /100 | #130 | Excellent 47.3% |
| Icelanders | 82.4 /100 | #131 | Excellent 47.3% |
| Afghans | 81.8 /100 | #132 | Excellent 47.3% |
| Immigrants | Malaysia | 81.1 /100 | #133 | Excellent 47.3% |
| Immigrants | Australia | 81.1 /100 | #134 | Excellent 47.3% |
| Immigrants | Norway | 79.7 /100 | #135 | Good 47.2% |
Demographics Similar to Cree by Currently Married
In terms of currently married, the demographic groups most similar to Cree are Immigrants from Kenya (44.9%, a difference of 0.040%), Immigrants from Panama (44.9%, a difference of 0.080%), Spanish American (45.0%, a difference of 0.19%), Immigrants from Uruguay (45.0%, a difference of 0.19%), and Comanche (45.0%, a difference of 0.20%).
| Demographics | Rating | Rank | Currently Married |
| Immigrants | Azores | 2.5 /100 | #222 | Tragic 45.1% |
| Immigrants | Laos | 2.3 /100 | #223 | Tragic 45.0% |
| Immigrants | Uganda | 2.2 /100 | #224 | Tragic 45.0% |
| French American Indians | 2.2 /100 | #225 | Tragic 45.0% |
| Comanche | 2.1 /100 | #226 | Tragic 45.0% |
| Spanish Americans | 2.1 /100 | #227 | Tragic 45.0% |
| Immigrants | Uruguay | 2.0 /100 | #228 | Tragic 45.0% |
| Cree | 1.7 /100 | #229 | Tragic 44.9% |
| Immigrants | Kenya | 1.6 /100 | #230 | Tragic 44.9% |
| Immigrants | Panama | 1.5 /100 | #231 | Tragic 44.9% |
| Nepalese | 1.2 /100 | #232 | Tragic 44.7% |
| Immigrants | Saudi Arabia | 1.1 /100 | #233 | Tragic 44.7% |
| Iroquois | 1.1 /100 | #234 | Tragic 44.7% |
| Alaskan Athabascans | 0.9 /100 | #235 | Tragic 44.6% |
| Cubans | 0.9 /100 | #236 | Tragic 44.6% |