Portuguese vs Immigrants from Singapore Currently Married

COMPARE

Portuguese
Race
Ancestry
AfghanAfricanAlaska NativeAlaskan AthabascanAlbanianAleutAlsatianAmericanApacheArabArapahoArgentineanArmenianAssyrian/Chaldean/SyriacAustralianAustrianBahamianBangladeshiBarbadianBasqueBelgianBelizeanBermudanBhutaneseBlackfeetBolivianBrazilianBritishBritish West IndianBulgarianBurmeseCajunCambodianCanadianCape VerdeanCarpatho RusynCelticCentral AmericanCentral American IndianCherokeeCheyenneChickasawChileanChineseChippewaChoctawColombianColvilleComancheCosta RicanCreeCreekCroatianCrowCubanCypriotCzechCzechoslovakianDanishDelawareDominicanDutchDutch West IndianEastern EuropeanEcuadorianEgyptianEnglishEstonianEthiopianEuropeanFijianFilipinoFinnishFrenchFrench American IndianFrench CanadianGermanGerman RussianGhanaianGreekGuamanian/ChamorroGuatemalanGuyaneseHaitianHmongHonduranHopiHoumaHungarianIcelanderIndian (Asian)IndonesianInupiatIranianIraqiIrishIroquoisIsraeliItalianJamaicanJapaneseJordanianKenyanKiowaKoreanLaotianLatvianLebaneseLiberianLithuanianLumbeeLuxembourgerMacedonianMalaysianMalteseMarshalleseMenomineeMexicanMexican American IndianMongolianMoroccanNative HawaiianNavajoNepaleseNew ZealanderNicaraguanNigerianNorthern EuropeanNorwegianOkinawanOsageOttawaPaiutePakistaniPalestinianPanamanianParaguayanPennsylvania GermanPeruvianPimaPolishPortuguesePotawatomiPuebloPuerto RicanPuget Sound SalishRomanianRussianSalvadoranSamoanScandinavianScotch-IrishScottishSeminoleSenegaleseSerbianShoshoneSierra LeoneanSiouxSlavicSlovakSloveneSomaliSouth AfricanSouth AmericanSouth American IndianSoviet UnionSpaniardSpanishSpanish AmericanSpanish American IndianSri LankanSubsaharan AfricanSudaneseSwedishSwissSyrianTaiwaneseThaiTlingit-HaidaTohono O'OdhamTonganTrinidadian and TobagonianTsimshianTurkishU.S. Virgin IslanderUgandanUkrainianUruguayanUteVenezuelanVietnameseWelshWest IndianYakamaYaquiYugoslavianYumanYup'ikZimbabwean
Immigration
NonimmigrantsImmigrantsAfghanistanAfricaAlbaniaArgentinaArmeniaAsiaAustraliaAustriaBahamasBangladeshBarbadosBelarusBelgiumBelizeBoliviaBosnia and HerzegovinaBrazilBulgariaBurma/MyanmarCabo VerdeCambodiaCameroonCanadaCaribbeanCentral AmericaChileChinaColombiaCongoCosta RicaCroatiaCubaCzechoslovakiaDenmarkDominicaDominican RepublicEastern AfricaEastern AsiaEastern EuropeEcuadorEgyptEl SalvadorEnglandEritreaEthiopiaEuropeFijiFranceGermanyGhanaGreeceGrenadaGuatemalaGuyanaHaitiHondurasHong KongHungaryIndiaIndonesiaIranIraqIrelandIsraelItalyJamaicaJapanJordanKazakhstanKenyaKoreaKuwaitLaosLatin AmericaLatviaLebanonLiberiaLithuaniaMalaysiaMexicoMicronesiaMiddle AfricaMoldovaMoroccoNepalNetherlandsNicaraguaNigeriaNorth AmericaNorth MacedoniaNorthern AfricaNorthern EuropeNorwayOceaniaPakistanPanamaPeruPhilippinesPolandPortugalRomaniaRussiaSaudi ArabiaScotlandSenegalSerbiaSierra LeoneSomaliaSouth AfricaSouth AmericaSouth Central AsiaSouth Eastern AsiaSouthern EuropeSpainSri LankaSt. Vincent and the GrenadinesSudanSwedenSwitzerlandSyriaTaiwanThailandTrinidad and TobagoTurkeyUgandaUkraineUruguayUzbekistanVenezuelaVietnamWest IndiesWestern AfricaWestern AsiaWestern EuropeYemenZaireZimbabweAzores
Immigrants from Singapore
Race
Ancestry
AfghanAfricanAlaska NativeAlaskan AthabascanAlbanianAleutAlsatianAmericanApacheArabArapahoArgentineanArmenianAssyrian/Chaldean/SyriacAustralianAustrianBahamianBangladeshiBarbadianBasqueBelgianBelizeanBermudanBhutaneseBlackfeetBolivianBrazilianBritishBritish West IndianBulgarianBurmeseCajunCambodianCanadianCape VerdeanCarpatho RusynCelticCentral AmericanCentral American IndianCherokeeCheyenneChickasawChileanChineseChippewaChoctawColombianColvilleComancheCosta RicanCreeCreekCroatianCrowCubanCypriotCzechCzechoslovakianDanishDelawareDominicanDutchDutch West IndianEastern EuropeanEcuadorianEgyptianEnglishEstonianEthiopianEuropeanFijianFilipinoFinnishFrenchFrench American IndianFrench CanadianGermanGerman RussianGhanaianGreekGuamanian/ChamorroGuatemalanGuyaneseHaitianHmongHonduranHopiHoumaHungarianIcelanderIndian (Asian)IndonesianInupiatIranianIraqiIrishIroquoisIsraeliItalianJamaicanJapaneseJordanianKenyanKiowaKoreanLaotianLatvianLebaneseLiberianLithuanianLumbeeLuxembourgerMacedonianMalaysianMalteseMarshalleseMenomineeMexicanMexican American IndianMongolianMoroccanNative HawaiianNavajoNepaleseNew ZealanderNicaraguanNigerianNorthern EuropeanNorwegianOkinawanOsageOttawaPaiutePakistaniPalestinianPanamanianParaguayanPennsylvania GermanPeruvianPimaPolishPotawatomiPuebloPuerto RicanPuget Sound SalishRomanianRussianSalvadoranSamoanScandinavianScotch-IrishScottishSeminoleSenegaleseSerbianShoshoneSierra LeoneanSiouxSlavicSlovakSloveneSomaliSouth AfricanSouth AmericanSouth American IndianSoviet UnionSpaniardSpanishSpanish AmericanSpanish American IndianSri LankanSubsaharan AfricanSudaneseSwedishSwissSyrianTaiwaneseThaiTlingit-HaidaTohono O'OdhamTonganTrinidadian and TobagonianTsimshianTurkishU.S. Virgin IslanderUgandanUkrainianUruguayanUteVenezuelanVietnameseWelshWest IndianYakamaYaquiYugoslavianYumanYup'ikZimbabwean
Immigration
NonimmigrantsImmigrantsAfghanistanAfricaAlbaniaArgentinaArmeniaAsiaAustraliaAustriaBahamasBangladeshBarbadosBelarusBelgiumBelizeBoliviaBosnia and HerzegovinaBrazilBulgariaBurma/MyanmarCabo VerdeCambodiaCameroonCanadaCaribbeanCentral AmericaChileChinaColombiaCongoCosta RicaCroatiaCubaCzechoslovakiaDenmarkDominicaDominican RepublicEastern AfricaEastern AsiaEastern EuropeEcuadorEgyptEl SalvadorEnglandEritreaEthiopiaEuropeFijiFranceGermanyGhanaGreeceGrenadaGuatemalaGuyanaHaitiHondurasHong KongHungaryIndiaIndonesiaIranIraqIrelandIsraelItalyJamaicaJapanJordanKazakhstanKenyaKoreaKuwaitLaosLatin AmericaLatviaLebanonLiberiaLithuaniaMalaysiaMexicoMicronesiaMiddle AfricaMoldovaMoroccoNepalNetherlandsNicaraguaNigeriaNorth AmericaNorth MacedoniaNorthern AfricaNorthern EuropeNorwayOceaniaPakistanPanamaPeruPhilippinesPolandPortugalRomaniaRussiaSaudi ArabiaScotlandSenegalSerbiaSierra LeoneSingaporeSomaliaSouth AfricaSouth AmericaSouth Central AsiaSouth Eastern AsiaSouthern EuropeSpainSri LankaSt. Vincent and the GrenadinesSudanSwedenSwitzerlandSyriaTaiwanThailandTrinidad and TobagoTurkeyUgandaUkraineUruguayUzbekistanVenezuelaVietnamWest IndiesWestern AfricaWestern AsiaWestern EuropeYemenZaireZimbabweAzores
Currently Married
Income
Poverty
Unemployment
Labor Participation
Family Structure
Vehicle Availability
Education Level
Disability

Currently Married Comparison

Portuguese

Immigrants from Singapore

Excellent
Exceptional
47.3%
CURRENTLY MARRIED
84.2/ 100
METRIC RATING
128th/ 347
METRIC RANK
47.8%
CURRENTLY MARRIED
93.3/ 100
METRIC RATING
105th/ 347
METRIC RANK

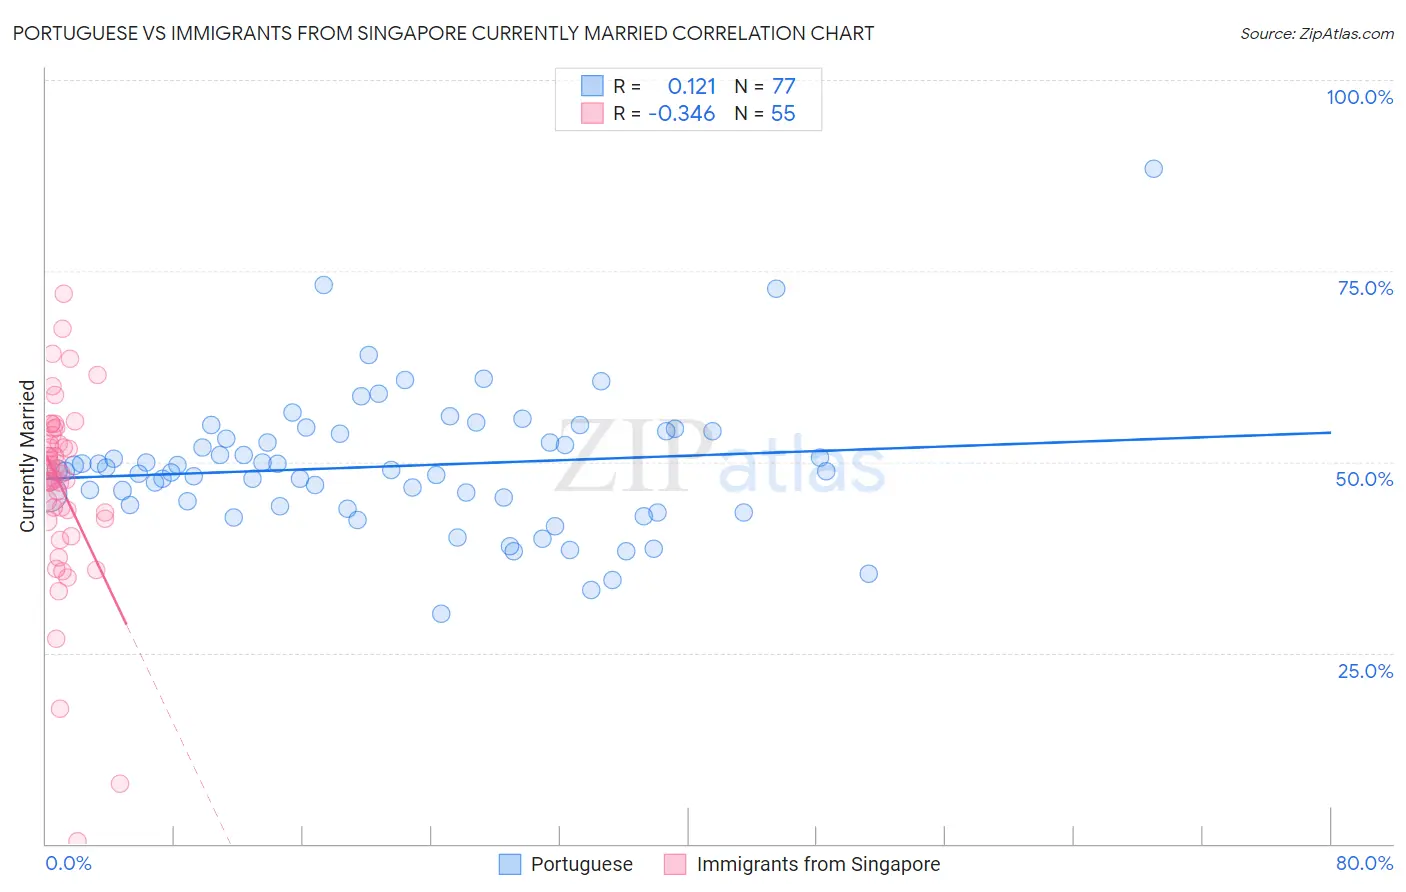
Portuguese vs Immigrants from Singapore Currently Married Correlation Chart

The statistical analysis conducted on geographies consisting of 450,286,612 people shows a poor positive correlation between the proportion of Portuguese and percentage of population currently married in the United States with a correlation coefficient (R) of 0.121 and weighted average of 47.3%. Similarly, the statistical analysis conducted on geographies consisting of 137,494,122 people shows a mild negative correlation between the proportion of Immigrants from Singapore and percentage of population currently married in the United States with a correlation coefficient (R) of -0.346 and weighted average of 47.8%, a difference of 0.86%.
Portuguese vs Immigrants from Singapore Currently Married

Currently Married Correlation Summary

MeasurementPortugueseImmigrants from Singapore
Minimum30.1%0.40%
Maximum88.3%72.0%
Range58.2%71.6%
Mean49.4%46.7%
Median48.9%48.4%
Interquartile 25% (IQ1)44.3%42.6%
Interquartile 75% (IQ3)53.9%53.5%
Interquartile Range (IQR)9.5%10.9%
Standard Deviation (Sample)8.9%12.7%
Standard Deviation (Population)8.9%12.6%

Similar Demographics by Currently Married

Demographics Similar to Portuguese by Currently Married

In terms of currently married, the demographic groups most similar to Portuguese are New Zealander (47.4%, a difference of 0.040%), Immigrants from Jordan (47.4%, a difference of 0.050%), Sri Lankan (47.3%, a difference of 0.060%), Okinawan (47.4%, a difference of 0.080%), and Immigrants from Iraq (47.3%, a difference of 0.090%).
DemographicsRating | RankCurrently Married
Immigrants | Croatia
88.6
/100
|
#121
Excellent
47.5%
Osage
87.9
/100
|
#122
Excellent
47.5%
Immigrants | Kazakhstan
87.2
/100
|
#123
Excellent
47.4%
Laotians
86.6
/100
|
#124
Excellent
47.4%
Okinawans
85.3
/100
|
#125
Excellent
47.4%
Immigrants | Jordan
84.9
/100
|
#126
Excellent
47.4%
New Zealanders
84.9
/100
|
#127
Excellent
47.4%
Portuguese
84.2
/100
|
#128
Excellent
47.3%
Sri Lankans
83.2
/100
|
#129
Excellent
47.3%
Immigrants | Iraq
82.8
/100
|
#130
Excellent
47.3%
Icelanders
82.4
/100
|
#131
Excellent
47.3%
Afghans
81.8
/100
|
#132
Excellent
47.3%
Immigrants | Malaysia
81.1
/100
|
#133
Excellent
47.3%
Immigrants | Australia
81.1
/100
|
#134
Excellent
47.3%
Immigrants | Norway
79.7
/100
|
#135
Good
47.2%

Demographics Similar to Immigrants from Singapore by Currently Married

In terms of currently married, the demographic groups most similar to Immigrants from Singapore are Immigrants from Greece (47.7%, a difference of 0.030%), Serbian (47.8%, a difference of 0.050%), Immigrants from Italy (47.7%, a difference of 0.060%), Cypriot (47.8%, a difference of 0.070%), and Turkish (47.8%, a difference of 0.090%).
DemographicsRating | RankCurrently Married
Immigrants | China
94.7
/100
|
#98
Exceptional
47.9%
Immigrants | Sweden
94.3
/100
|
#99
Exceptional
47.8%
Celtics
94.2
/100
|
#100
Exceptional
47.8%
Immigrants | Germany
94.1
/100
|
#101
Exceptional
47.8%
Turks
93.9
/100
|
#102
Exceptional
47.8%
Cypriots
93.7
/100
|
#103
Exceptional
47.8%
Serbians
93.6
/100
|
#104
Exceptional
47.8%
Immigrants | Singapore
93.3
/100
|
#105
Exceptional
47.8%
Immigrants | Greece
93.1
/100
|
#106
Exceptional
47.7%
Immigrants | Italy
92.9
/100
|
#107
Exceptional
47.7%
Tsimshian
92.4
/100
|
#108
Exceptional
47.7%
Immigrants | Egypt
92.3
/100
|
#109
Exceptional
47.7%
Immigrants | Russia
92.0
/100
|
#110
Exceptional
47.7%
Immigrants | Hungary
91.2
/100
|
#111
Exceptional
47.6%
Immigrants | Western Europe
91.1
/100
|
#112
Exceptional
47.6%