Pima vs Italian Married-couple Households
COMPARE
Pima
Italian
Married-couple Households
Married-couple Households Comparison
Pima
Italians
35.6%
MARRIED-COUPLE HOUSEHOLDS
0.0/ 100
METRIC RATING
347th/ 347
METRIC RANK
49.0%
MARRIED-COUPLE HOUSEHOLDS
99.7/ 100
METRIC RATING
34th/ 347
METRIC RANK
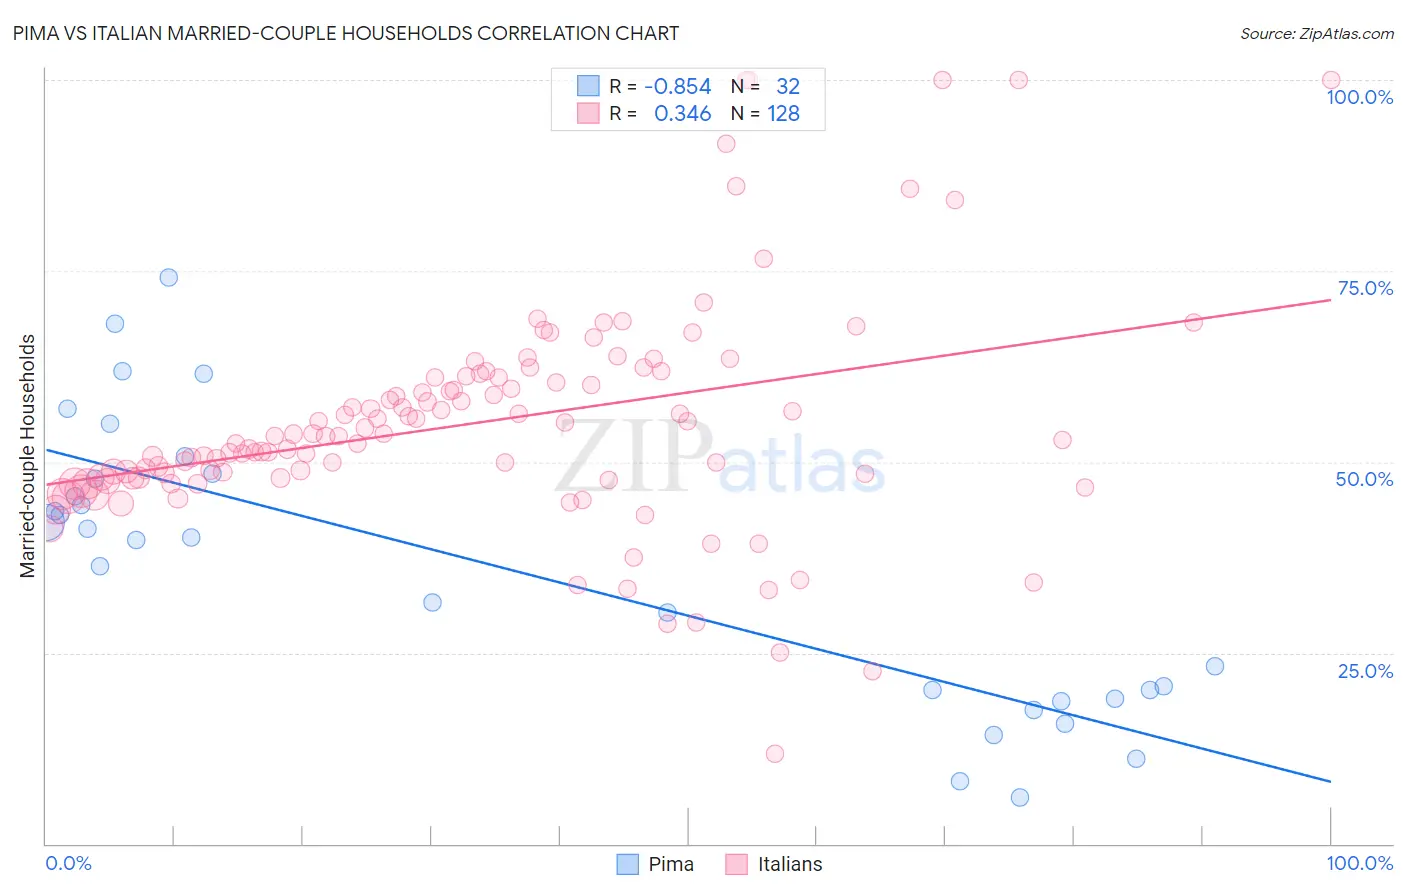
Pima vs Italian Married-couple Households Correlation Chart
The statistical analysis conducted on geographies consisting of 61,538,795 people shows a very strong negative correlation between the proportion of Pima and percentage of married-couple family households in the United States with a correlation coefficient (R) of -0.854 and weighted average of 35.6%. Similarly, the statistical analysis conducted on geographies consisting of 574,410,066 people shows a mild positive correlation between the proportion of Italians and percentage of married-couple family households in the United States with a correlation coefficient (R) of 0.346 and weighted average of 49.0%, a difference of 37.9%.
Married-couple Households Correlation Summary
| Measurement | Pima | Italian |
| Minimum | 6.1% | 11.8% |
| Maximum | 74.1% | 100.0% |
| Range | 68.0% | 88.2% |
| Mean | 36.2% | 55.1% |
| Median | 40.0% | 53.3% |
| Interquartile 25% (IQ1) | 19.6% | 47.9% |
| Interquartile 75% (IQ3) | 48.1% | 61.1% |
| Interquartile Range (IQR) | 28.5% | 13.2% |
| Standard Deviation (Sample) | 18.4% | 14.9% |
| Standard Deviation (Population) | 18.1% | 14.8% |
Similar Demographics by Married-couple Households
Demographics Similar to Pima by Married-couple Households
In terms of married-couple households, the demographic groups most similar to Pima are Immigrants from Cabo Verde (36.2%, a difference of 1.9%), Hopi (36.7%, a difference of 3.2%), Immigrants from Dominican Republic (37.3%, a difference of 5.0%), Immigrants from Grenada (37.5%, a difference of 5.5%), and Tohono O'odham (37.9%, a difference of 6.6%).
| Demographics | Rating | Rank | Married-couple Households |
| Immigrants | West Indies | 0.0 /100 | #333 | Tragic 39.0% |
| Immigrants | St. Vincent and the Grenadines | 0.0 /100 | #334 | Tragic 38.7% |
| Senegalese | 0.0 /100 | #335 | Tragic 38.6% |
| Blacks/African Americans | 0.0 /100 | #336 | Tragic 38.5% |
| Immigrants | Somalia | 0.0 /100 | #337 | Tragic 38.4% |
| Immigrants | Senegal | 0.0 /100 | #338 | Tragic 38.4% |
| British West Indians | 0.0 /100 | #339 | Tragic 38.3% |
| Dominicans | 0.0 /100 | #340 | Tragic 38.2% |
| Cape Verdeans | 0.0 /100 | #341 | Tragic 38.1% |
| Tohono O'odham | 0.0 /100 | #342 | Tragic 37.9% |
| Immigrants | Grenada | 0.0 /100 | #343 | Tragic 37.5% |
| Immigrants | Dominican Republic | 0.0 /100 | #344 | Tragic 37.3% |
| Hopi | 0.0 /100 | #345 | Tragic 36.7% |
| Immigrants | Cabo Verde | 0.0 /100 | #346 | Tragic 36.2% |
| Pima | 0.0 /100 | #347 | Tragic 35.6% |
Demographics Similar to Italians by Married-couple Households
In terms of married-couple households, the demographic groups most similar to Italians are Scottish (49.0%, a difference of 0.020%), Immigrants from Asia (49.1%, a difference of 0.080%), Hungarian (49.1%, a difference of 0.11%), Iranian (49.0%, a difference of 0.11%), and Sri Lankan (49.0%, a difference of 0.11%).
| Demographics | Rating | Rank | Married-couple Households |
| Bhutanese | 99.8 /100 | #27 | Exceptional 49.3% |
| Germans | 99.8 /100 | #28 | Exceptional 49.2% |
| Maltese | 99.8 /100 | #29 | Exceptional 49.2% |
| Bolivians | 99.8 /100 | #30 | Exceptional 49.2% |
| Native Hawaiians | 99.8 /100 | #31 | Exceptional 49.1% |
| Hungarians | 99.8 /100 | #32 | Exceptional 49.1% |
| Immigrants | Asia | 99.7 /100 | #33 | Exceptional 49.1% |
| Italians | 99.7 /100 | #34 | Exceptional 49.0% |
| Scottish | 99.7 /100 | #35 | Exceptional 49.0% |
| Iranians | 99.7 /100 | #36 | Exceptional 49.0% |
| Sri Lankans | 99.7 /100 | #37 | Exceptional 49.0% |
| Greeks | 99.7 /100 | #38 | Exceptional 48.9% |
| Lithuanians | 99.6 /100 | #39 | Exceptional 48.9% |
| Immigrants | Bolivia | 99.6 /100 | #40 | Exceptional 48.9% |
| Immigrants | Lebanon | 99.6 /100 | #41 | Exceptional 48.9% |