Peruvian vs Italian Married-couple Households
COMPARE
Peruvian
Italian
Married-couple Households
Married-couple Households Comparison
Peruvians
Italians
47.6%
MARRIED-COUPLE HOUSEHOLDS
93.8/ 100
METRIC RATING
112th/ 347
METRIC RANK
49.0%
MARRIED-COUPLE HOUSEHOLDS
99.7/ 100
METRIC RATING
34th/ 347
METRIC RANK
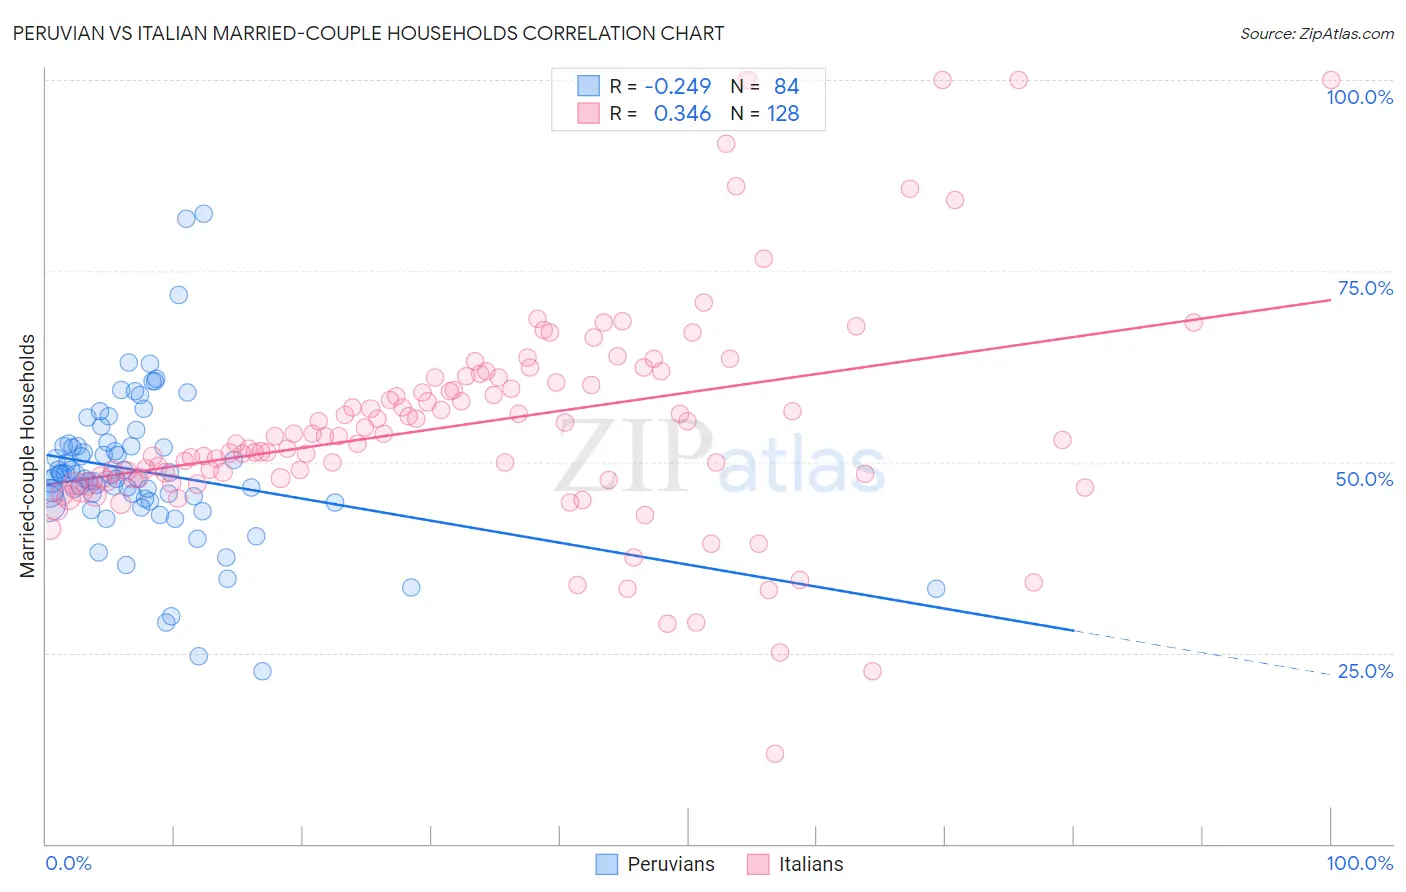
Peruvian vs Italian Married-couple Households Correlation Chart
The statistical analysis conducted on geographies consisting of 362,959,523 people shows a weak negative correlation between the proportion of Peruvians and percentage of married-couple family households in the United States with a correlation coefficient (R) of -0.249 and weighted average of 47.6%. Similarly, the statistical analysis conducted on geographies consisting of 574,410,066 people shows a mild positive correlation between the proportion of Italians and percentage of married-couple family households in the United States with a correlation coefficient (R) of 0.346 and weighted average of 49.0%, a difference of 2.9%.
Married-couple Households Correlation Summary
| Measurement | Peruvian | Italian |
| Minimum | 22.6% | 11.8% |
| Maximum | 82.5% | 100.0% |
| Range | 60.0% | 88.2% |
| Mean | 48.8% | 55.1% |
| Median | 48.1% | 53.3% |
| Interquartile 25% (IQ1) | 45.0% | 47.9% |
| Interquartile 75% (IQ3) | 52.0% | 61.1% |
| Interquartile Range (IQR) | 7.0% | 13.2% |
| Standard Deviation (Sample) | 9.8% | 14.9% |
| Standard Deviation (Population) | 9.8% | 14.8% |
Similar Demographics by Married-couple Households
Demographics Similar to Peruvians by Married-couple Households
In terms of married-couple households, the demographic groups most similar to Peruvians are Syrian (47.6%, a difference of 0.010%), Venezuelan (47.6%, a difference of 0.010%), Macedonian (47.6%, a difference of 0.020%), Immigrants from Europe (47.6%, a difference of 0.020%), and Immigrants from Jordan (47.7%, a difference of 0.040%).
| Demographics | Rating | Rank | Married-couple Households |
| Immigrants | Czechoslovakia | 95.5 /100 | #105 | Exceptional 47.8% |
| Portuguese | 95.5 /100 | #106 | Exceptional 47.8% |
| Estonians | 94.7 /100 | #107 | Exceptional 47.7% |
| Immigrants | Japan | 94.4 /100 | #108 | Exceptional 47.7% |
| Immigrants | Jordan | 94.1 /100 | #109 | Exceptional 47.7% |
| Macedonians | 93.9 /100 | #110 | Exceptional 47.6% |
| Syrians | 93.9 /100 | #111 | Exceptional 47.6% |
| Peruvians | 93.8 /100 | #112 | Exceptional 47.6% |
| Venezuelans | 93.8 /100 | #113 | Exceptional 47.6% |
| Immigrants | Europe | 93.7 /100 | #114 | Exceptional 47.6% |
| Slovaks | 92.9 /100 | #115 | Exceptional 47.6% |
| Argentineans | 92.5 /100 | #116 | Exceptional 47.5% |
| French Canadians | 92.4 /100 | #117 | Exceptional 47.5% |
| Immigrants | Germany | 92.4 /100 | #118 | Exceptional 47.5% |
| Chileans | 92.2 /100 | #119 | Exceptional 47.5% |
Demographics Similar to Italians by Married-couple Households
In terms of married-couple households, the demographic groups most similar to Italians are Scottish (49.0%, a difference of 0.020%), Immigrants from Asia (49.1%, a difference of 0.080%), Hungarian (49.1%, a difference of 0.11%), Iranian (49.0%, a difference of 0.11%), and Sri Lankan (49.0%, a difference of 0.11%).
| Demographics | Rating | Rank | Married-couple Households |
| Bhutanese | 99.8 /100 | #27 | Exceptional 49.3% |
| Germans | 99.8 /100 | #28 | Exceptional 49.2% |
| Maltese | 99.8 /100 | #29 | Exceptional 49.2% |
| Bolivians | 99.8 /100 | #30 | Exceptional 49.2% |
| Native Hawaiians | 99.8 /100 | #31 | Exceptional 49.1% |
| Hungarians | 99.8 /100 | #32 | Exceptional 49.1% |
| Immigrants | Asia | 99.7 /100 | #33 | Exceptional 49.1% |
| Italians | 99.7 /100 | #34 | Exceptional 49.0% |
| Scottish | 99.7 /100 | #35 | Exceptional 49.0% |
| Iranians | 99.7 /100 | #36 | Exceptional 49.0% |
| Sri Lankans | 99.7 /100 | #37 | Exceptional 49.0% |
| Greeks | 99.7 /100 | #38 | Exceptional 48.9% |
| Lithuanians | 99.6 /100 | #39 | Exceptional 48.9% |
| Immigrants | Bolivia | 99.6 /100 | #40 | Exceptional 48.9% |
| Immigrants | Lebanon | 99.6 /100 | #41 | Exceptional 48.9% |