Chilean vs Italian Married-couple Households
COMPARE
Chilean
Italian
Married-couple Households
Married-couple Households Comparison
Chileans
Italians
47.5%
MARRIED-COUPLE HOUSEHOLDS
92.2/ 100
METRIC RATING
119th/ 347
METRIC RANK
49.0%
MARRIED-COUPLE HOUSEHOLDS
99.7/ 100
METRIC RATING
34th/ 347
METRIC RANK
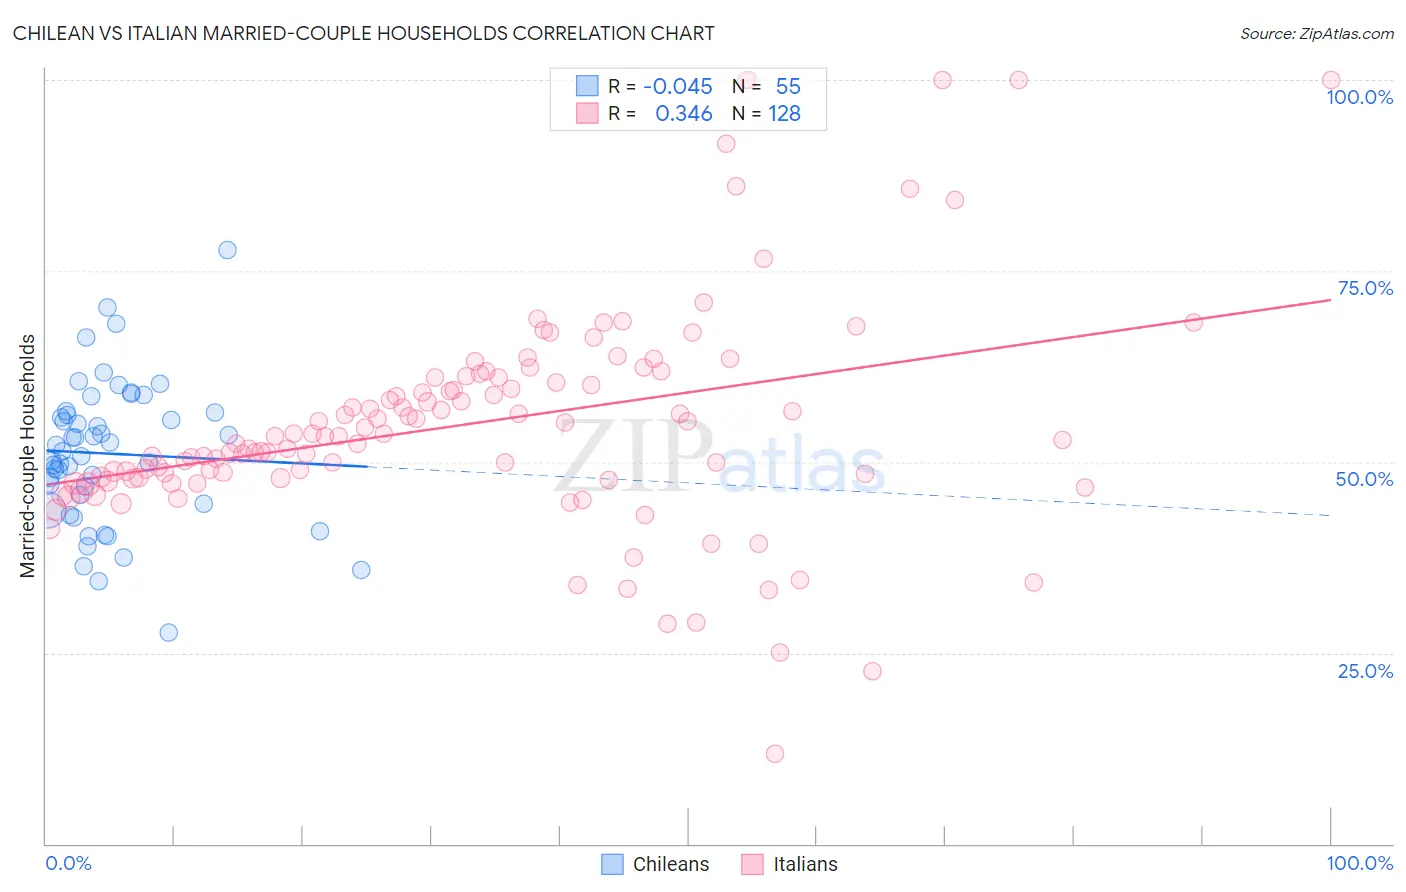
Chilean vs Italian Married-couple Households Correlation Chart
The statistical analysis conducted on geographies consisting of 256,556,346 people shows no correlation between the proportion of Chileans and percentage of married-couple family households in the United States with a correlation coefficient (R) of -0.045 and weighted average of 47.5%. Similarly, the statistical analysis conducted on geographies consisting of 574,410,066 people shows a mild positive correlation between the proportion of Italians and percentage of married-couple family households in the United States with a correlation coefficient (R) of 0.346 and weighted average of 49.0%, a difference of 3.2%.
Married-couple Households Correlation Summary
| Measurement | Chilean | Italian |
| Minimum | 27.7% | 11.8% |
| Maximum | 77.8% | 100.0% |
| Range | 50.1% | 88.2% |
| Mean | 51.1% | 55.1% |
| Median | 51.4% | 53.3% |
| Interquartile 25% (IQ1) | 44.6% | 47.9% |
| Interquartile 75% (IQ3) | 56.4% | 61.1% |
| Interquartile Range (IQR) | 11.8% | 13.2% |
| Standard Deviation (Sample) | 9.4% | 14.9% |
| Standard Deviation (Population) | 9.3% | 14.8% |
Similar Demographics by Married-couple Households
Demographics Similar to Chileans by Married-couple Households
In terms of married-couple households, the demographic groups most similar to Chileans are French Canadian (47.5%, a difference of 0.030%), Immigrants from Germany (47.5%, a difference of 0.030%), Argentinean (47.5%, a difference of 0.050%), Slovak (47.6%, a difference of 0.10%), and Puget Sound Salish (47.4%, a difference of 0.19%).
| Demographics | Rating | Rank | Married-couple Households |
| Peruvians | 93.8 /100 | #112 | Exceptional 47.6% |
| Venezuelans | 93.8 /100 | #113 | Exceptional 47.6% |
| Immigrants | Europe | 93.7 /100 | #114 | Exceptional 47.6% |
| Slovaks | 92.9 /100 | #115 | Exceptional 47.6% |
| Argentineans | 92.5 /100 | #116 | Exceptional 47.5% |
| French Canadians | 92.4 /100 | #117 | Exceptional 47.5% |
| Immigrants | Germany | 92.4 /100 | #118 | Exceptional 47.5% |
| Chileans | 92.2 /100 | #119 | Exceptional 47.5% |
| Puget Sound Salish | 90.5 /100 | #120 | Exceptional 47.4% |
| Immigrants | Eastern Europe | 90.3 /100 | #121 | Exceptional 47.4% |
| Okinawans | 90.1 /100 | #122 | Exceptional 47.4% |
| Immigrants | Venezuela | 89.3 /100 | #123 | Excellent 47.4% |
| Zimbabweans | 89.2 /100 | #124 | Excellent 47.4% |
| Australians | 89.0 /100 | #125 | Excellent 47.4% |
| Pakistanis | 88.6 /100 | #126 | Excellent 47.3% |
Demographics Similar to Italians by Married-couple Households
In terms of married-couple households, the demographic groups most similar to Italians are Scottish (49.0%, a difference of 0.020%), Immigrants from Asia (49.1%, a difference of 0.080%), Hungarian (49.1%, a difference of 0.11%), Iranian (49.0%, a difference of 0.11%), and Sri Lankan (49.0%, a difference of 0.11%).
| Demographics | Rating | Rank | Married-couple Households |
| Bhutanese | 99.8 /100 | #27 | Exceptional 49.3% |
| Germans | 99.8 /100 | #28 | Exceptional 49.2% |
| Maltese | 99.8 /100 | #29 | Exceptional 49.2% |
| Bolivians | 99.8 /100 | #30 | Exceptional 49.2% |
| Native Hawaiians | 99.8 /100 | #31 | Exceptional 49.1% |
| Hungarians | 99.8 /100 | #32 | Exceptional 49.1% |
| Immigrants | Asia | 99.7 /100 | #33 | Exceptional 49.1% |
| Italians | 99.7 /100 | #34 | Exceptional 49.0% |
| Scottish | 99.7 /100 | #35 | Exceptional 49.0% |
| Iranians | 99.7 /100 | #36 | Exceptional 49.0% |
| Sri Lankans | 99.7 /100 | #37 | Exceptional 49.0% |
| Greeks | 99.7 /100 | #38 | Exceptional 48.9% |
| Lithuanians | 99.6 /100 | #39 | Exceptional 48.9% |
| Immigrants | Bolivia | 99.6 /100 | #40 | Exceptional 48.9% |
| Immigrants | Lebanon | 99.6 /100 | #41 | Exceptional 48.9% |