Pima vs Belizean Married-couple Households
COMPARE
Pima
Belizean
Married-couple Households
Married-couple Households Comparison
Pima
Belizeans
35.6%
MARRIED-COUPLE HOUSEHOLDS
0.0/ 100
METRIC RATING
347th/ 347
METRIC RANK
42.2%
MARRIED-COUPLE HOUSEHOLDS
0.0/ 100
METRIC RATING
286th/ 347
METRIC RANK
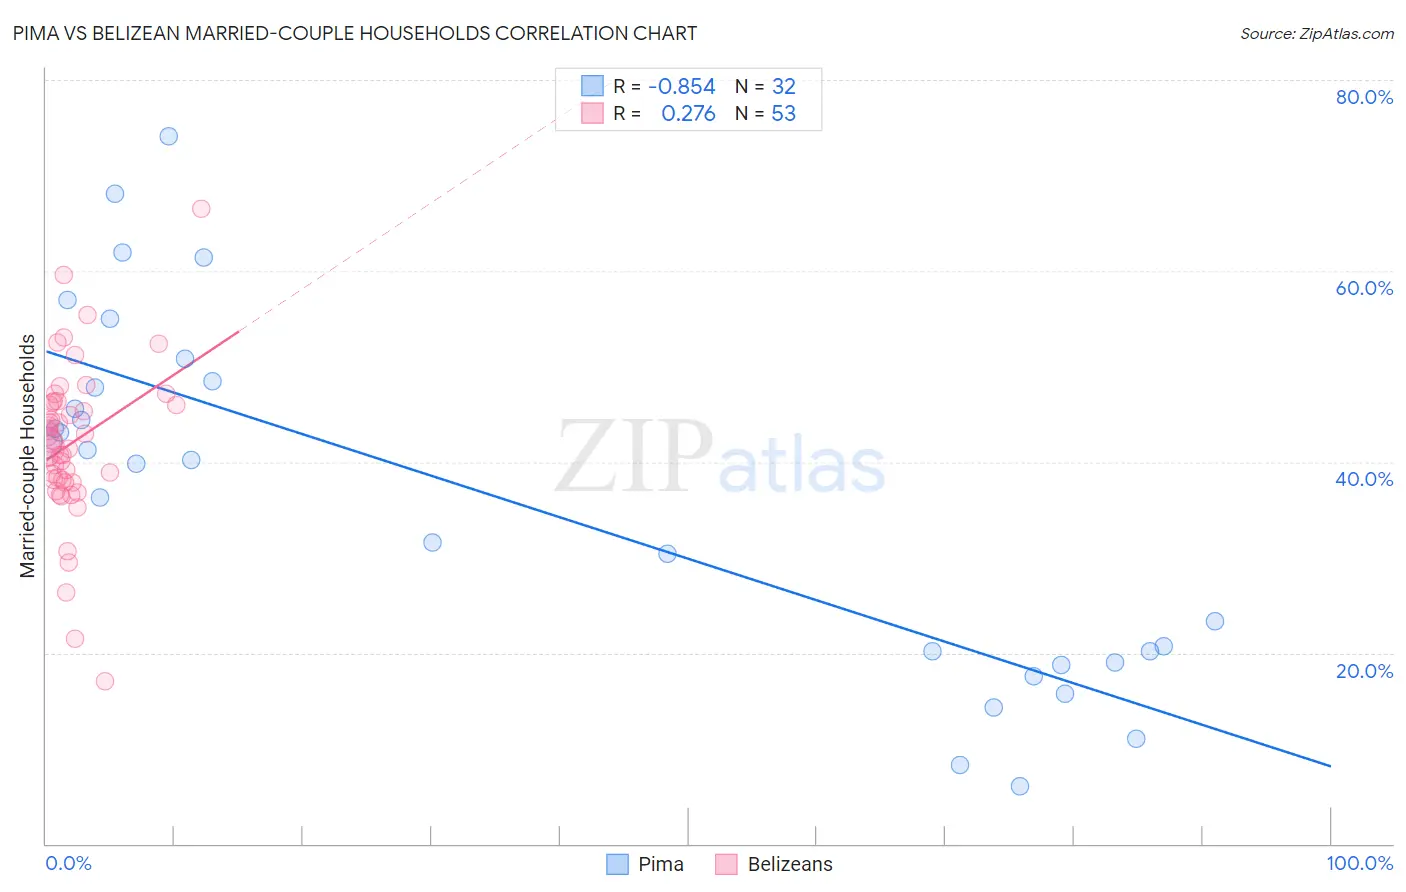
Pima vs Belizean Married-couple Households Correlation Chart
The statistical analysis conducted on geographies consisting of 61,538,795 people shows a very strong negative correlation between the proportion of Pima and percentage of married-couple family households in the United States with a correlation coefficient (R) of -0.854 and weighted average of 35.6%. Similarly, the statistical analysis conducted on geographies consisting of 144,151,479 people shows a weak positive correlation between the proportion of Belizeans and percentage of married-couple family households in the United States with a correlation coefficient (R) of 0.276 and weighted average of 42.2%, a difference of 18.8%.
Married-couple Households Correlation Summary
| Measurement | Pima | Belizean |
| Minimum | 6.1% | 17.1% |
| Maximum | 74.1% | 66.5% |
| Range | 68.0% | 49.4% |
| Mean | 36.2% | 42.0% |
| Median | 40.0% | 41.9% |
| Interquartile 25% (IQ1) | 19.6% | 38.0% |
| Interquartile 75% (IQ3) | 48.1% | 46.3% |
| Interquartile Range (IQR) | 28.5% | 8.3% |
| Standard Deviation (Sample) | 18.4% | 8.4% |
| Standard Deviation (Population) | 18.1% | 8.3% |
Similar Demographics by Married-couple Households
Demographics Similar to Pima by Married-couple Households
In terms of married-couple households, the demographic groups most similar to Pima are Immigrants from Cabo Verde (36.2%, a difference of 1.9%), Hopi (36.7%, a difference of 3.2%), Immigrants from Dominican Republic (37.3%, a difference of 5.0%), Immigrants from Grenada (37.5%, a difference of 5.5%), and Tohono O'odham (37.9%, a difference of 6.6%).
| Demographics | Rating | Rank | Married-couple Households |
| Immigrants | West Indies | 0.0 /100 | #333 | Tragic 39.0% |
| Immigrants | St. Vincent and the Grenadines | 0.0 /100 | #334 | Tragic 38.7% |
| Senegalese | 0.0 /100 | #335 | Tragic 38.6% |
| Blacks/African Americans | 0.0 /100 | #336 | Tragic 38.5% |
| Immigrants | Somalia | 0.0 /100 | #337 | Tragic 38.4% |
| Immigrants | Senegal | 0.0 /100 | #338 | Tragic 38.4% |
| British West Indians | 0.0 /100 | #339 | Tragic 38.3% |
| Dominicans | 0.0 /100 | #340 | Tragic 38.2% |
| Cape Verdeans | 0.0 /100 | #341 | Tragic 38.1% |
| Tohono O'odham | 0.0 /100 | #342 | Tragic 37.9% |
| Immigrants | Grenada | 0.0 /100 | #343 | Tragic 37.5% |
| Immigrants | Dominican Republic | 0.0 /100 | #344 | Tragic 37.3% |
| Hopi | 0.0 /100 | #345 | Tragic 36.7% |
| Immigrants | Cabo Verde | 0.0 /100 | #346 | Tragic 36.2% |
| Pima | 0.0 /100 | #347 | Tragic 35.6% |
Demographics Similar to Belizeans by Married-couple Households
In terms of married-couple households, the demographic groups most similar to Belizeans are Ghanaian (42.2%, a difference of 0.010%), Cheyenne (42.3%, a difference of 0.040%), Chippewa (42.1%, a difference of 0.24%), Immigrants from Eritrea (42.1%, a difference of 0.32%), and Sudanese (42.1%, a difference of 0.37%).
| Demographics | Rating | Rank | Married-couple Households |
| Sierra Leoneans | 0.0 /100 | #279 | Tragic 42.9% |
| Immigrants | Ecuador | 0.0 /100 | #280 | Tragic 42.9% |
| Immigrants | Guatemala | 0.0 /100 | #281 | Tragic 42.8% |
| Bermudans | 0.0 /100 | #282 | Tragic 42.4% |
| Inupiat | 0.0 /100 | #283 | Tragic 42.4% |
| Cheyenne | 0.0 /100 | #284 | Tragic 42.3% |
| Ghanaians | 0.0 /100 | #285 | Tragic 42.2% |
| Belizeans | 0.0 /100 | #286 | Tragic 42.2% |
| Chippewa | 0.0 /100 | #287 | Tragic 42.1% |
| Immigrants | Eritrea | 0.0 /100 | #288 | Tragic 42.1% |
| Sudanese | 0.0 /100 | #289 | Tragic 42.1% |
| Hondurans | 0.0 /100 | #290 | Tragic 42.1% |
| Paiute | 0.0 /100 | #291 | Tragic 42.1% |
| Indonesians | 0.0 /100 | #292 | Tragic 42.0% |
| Menominee | 0.0 /100 | #293 | Tragic 42.0% |