Pima vs Norwegian Married-couple Households
COMPARE
Pima
Norwegian
Married-couple Households
Married-couple Households Comparison
Pima
Norwegians
35.6%
MARRIED-COUPLE HOUSEHOLDS
0.0/ 100
METRIC RATING
347th/ 347
METRIC RANK
49.5%
MARRIED-COUPLE HOUSEHOLDS
99.9/ 100
METRIC RATING
21st/ 347
METRIC RANK
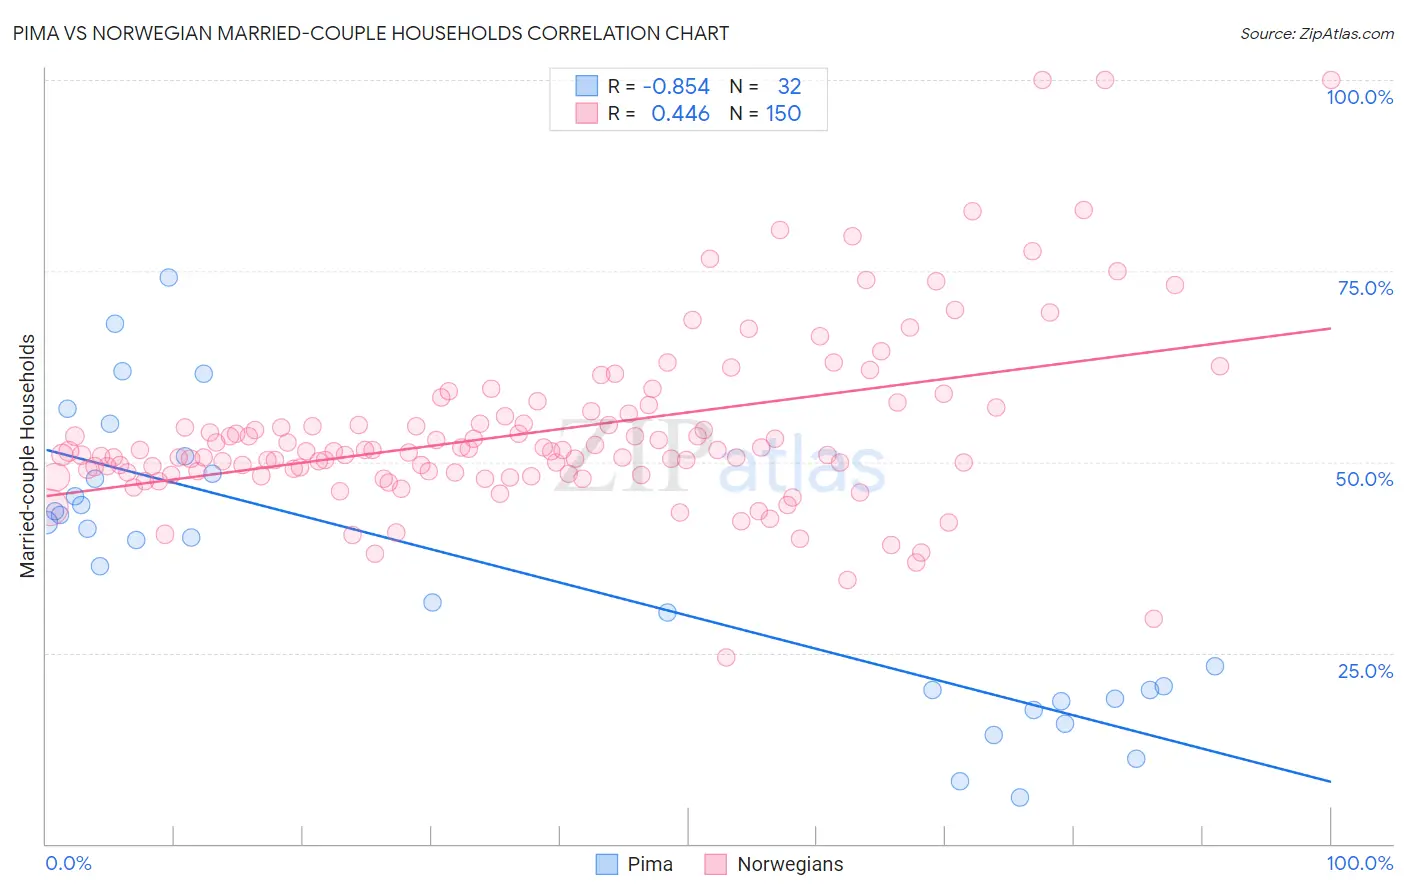
Pima vs Norwegian Married-couple Households Correlation Chart
The statistical analysis conducted on geographies consisting of 61,538,795 people shows a very strong negative correlation between the proportion of Pima and percentage of married-couple family households in the United States with a correlation coefficient (R) of -0.854 and weighted average of 35.6%. Similarly, the statistical analysis conducted on geographies consisting of 532,882,581 people shows a moderate positive correlation between the proportion of Norwegians and percentage of married-couple family households in the United States with a correlation coefficient (R) of 0.446 and weighted average of 49.5%, a difference of 39.3%.
Married-couple Households Correlation Summary
| Measurement | Pima | Norwegian |
| Minimum | 6.1% | 24.5% |
| Maximum | 74.1% | 100.0% |
| Range | 68.0% | 75.5% |
| Mean | 36.2% | 54.0% |
| Median | 40.0% | 51.4% |
| Interquartile 25% (IQ1) | 19.6% | 48.6% |
| Interquartile 75% (IQ3) | 48.1% | 56.3% |
| Interquartile Range (IQR) | 28.5% | 7.7% |
| Standard Deviation (Sample) | 18.4% | 11.6% |
| Standard Deviation (Population) | 18.1% | 11.6% |
Similar Demographics by Married-couple Households
Demographics Similar to Pima by Married-couple Households
In terms of married-couple households, the demographic groups most similar to Pima are Immigrants from Cabo Verde (36.2%, a difference of 1.9%), Hopi (36.7%, a difference of 3.2%), Immigrants from Dominican Republic (37.3%, a difference of 5.0%), Immigrants from Grenada (37.5%, a difference of 5.5%), and Tohono O'odham (37.9%, a difference of 6.6%).
| Demographics | Rating | Rank | Married-couple Households |
| Immigrants | West Indies | 0.0 /100 | #333 | Tragic 39.0% |
| Immigrants | St. Vincent and the Grenadines | 0.0 /100 | #334 | Tragic 38.7% |
| Senegalese | 0.0 /100 | #335 | Tragic 38.6% |
| Blacks/African Americans | 0.0 /100 | #336 | Tragic 38.5% |
| Immigrants | Somalia | 0.0 /100 | #337 | Tragic 38.4% |
| Immigrants | Senegal | 0.0 /100 | #338 | Tragic 38.4% |
| British West Indians | 0.0 /100 | #339 | Tragic 38.3% |
| Dominicans | 0.0 /100 | #340 | Tragic 38.2% |
| Cape Verdeans | 0.0 /100 | #341 | Tragic 38.1% |
| Tohono O'odham | 0.0 /100 | #342 | Tragic 37.9% |
| Immigrants | Grenada | 0.0 /100 | #343 | Tragic 37.5% |
| Immigrants | Dominican Republic | 0.0 /100 | #344 | Tragic 37.3% |
| Hopi | 0.0 /100 | #345 | Tragic 36.7% |
| Immigrants | Cabo Verde | 0.0 /100 | #346 | Tragic 36.2% |
| Pima | 0.0 /100 | #347 | Tragic 35.6% |
Demographics Similar to Norwegians by Married-couple Households
In terms of married-couple households, the demographic groups most similar to Norwegians are Scandinavian (49.6%, a difference of 0.050%), European (49.6%, a difference of 0.060%), Asian (49.5%, a difference of 0.11%), Dutch (49.5%, a difference of 0.12%), and Czech (49.4%, a difference of 0.20%).
| Demographics | Rating | Rank | Married-couple Households |
| Burmese | 100.0 /100 | #14 | Exceptional 49.8% |
| Koreans | 99.9 /100 | #15 | Exceptional 49.7% |
| Swedes | 99.9 /100 | #16 | Exceptional 49.7% |
| Immigrants | Hong Kong | 99.9 /100 | #17 | Exceptional 49.6% |
| English | 99.9 /100 | #18 | Exceptional 49.6% |
| Europeans | 99.9 /100 | #19 | Exceptional 49.6% |
| Scandinavians | 99.9 /100 | #20 | Exceptional 49.6% |
| Norwegians | 99.9 /100 | #21 | Exceptional 49.5% |
| Asians | 99.9 /100 | #22 | Exceptional 49.5% |
| Dutch | 99.9 /100 | #23 | Exceptional 49.5% |
| Czechs | 99.9 /100 | #24 | Exceptional 49.4% |
| Immigrants | Philippines | 99.9 /100 | #25 | Exceptional 49.3% |
| Immigrants | Scotland | 99.8 /100 | #26 | Exceptional 49.3% |
| Bhutanese | 99.8 /100 | #27 | Exceptional 49.3% |
| Germans | 99.8 /100 | #28 | Exceptional 49.2% |