Finnish vs Italian Married-couple Households
COMPARE
Finnish
Italian
Married-couple Households
Married-couple Households Comparison
Finns
Italians
48.1%
MARRIED-COUPLE HOUSEHOLDS
98.0/ 100
METRIC RATING
81st/ 347
METRIC RANK
49.0%
MARRIED-COUPLE HOUSEHOLDS
99.7/ 100
METRIC RATING
34th/ 347
METRIC RANK
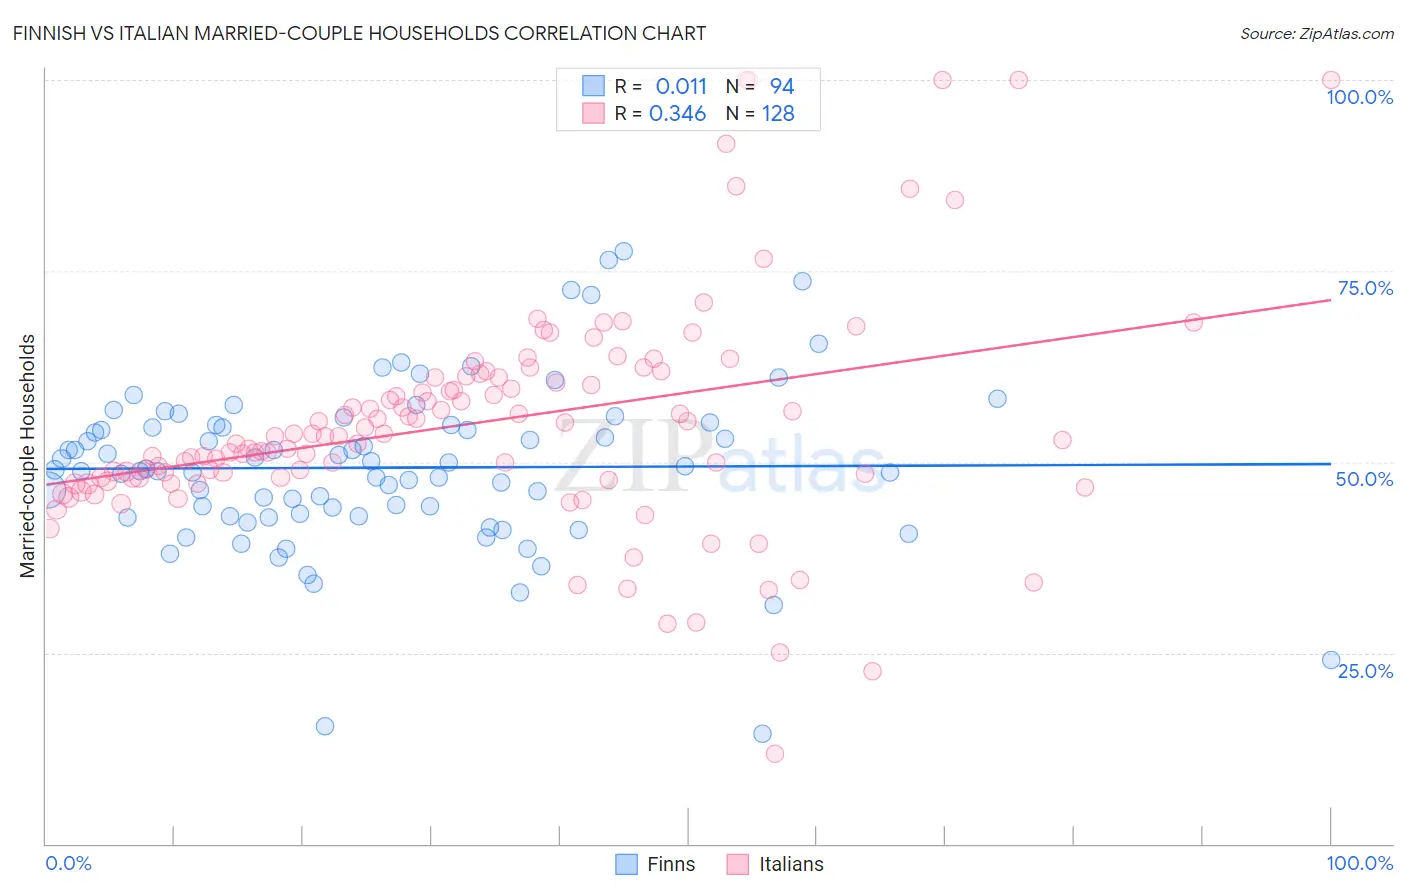
Finnish vs Italian Married-couple Households Correlation Chart
The statistical analysis conducted on geographies consisting of 404,503,243 people shows no correlation between the proportion of Finns and percentage of married-couple family households in the United States with a correlation coefficient (R) of 0.011 and weighted average of 48.1%. Similarly, the statistical analysis conducted on geographies consisting of 574,410,066 people shows a mild positive correlation between the proportion of Italians and percentage of married-couple family households in the United States with a correlation coefficient (R) of 0.346 and weighted average of 49.0%, a difference of 1.8%.
Married-couple Households Correlation Summary
| Measurement | Finnish | Italian |
| Minimum | 14.4% | 11.8% |
| Maximum | 77.6% | 100.0% |
| Range | 63.1% | 88.2% |
| Mean | 49.2% | 55.1% |
| Median | 49.0% | 53.3% |
| Interquartile 25% (IQ1) | 42.9% | 47.9% |
| Interquartile 75% (IQ3) | 54.8% | 61.1% |
| Interquartile Range (IQR) | 11.8% | 13.2% |
| Standard Deviation (Sample) | 10.8% | 14.9% |
| Standard Deviation (Population) | 10.8% | 14.8% |
Similar Demographics by Married-couple Households
Demographics Similar to Finns by Married-couple Households
In terms of married-couple households, the demographic groups most similar to Finns are Russian (48.2%, a difference of 0.060%), Egyptian (48.2%, a difference of 0.090%), Immigrants from Netherlands (48.2%, a difference of 0.090%), Canadian (48.2%, a difference of 0.11%), and Immigrants from Poland (48.1%, a difference of 0.14%).
| Demographics | Rating | Rank | Married-couple Households |
| Immigrants | Romania | 98.6 /100 | #74 | Exceptional 48.3% |
| Immigrants | England | 98.4 /100 | #75 | Exceptional 48.2% |
| Immigrants | Fiji | 98.4 /100 | #76 | Exceptional 48.2% |
| Canadians | 98.2 /100 | #77 | Exceptional 48.2% |
| Egyptians | 98.2 /100 | #78 | Exceptional 48.2% |
| Immigrants | Netherlands | 98.2 /100 | #79 | Exceptional 48.2% |
| Russians | 98.1 /100 | #80 | Exceptional 48.2% |
| Finns | 98.0 /100 | #81 | Exceptional 48.1% |
| Immigrants | Poland | 97.7 /100 | #82 | Exceptional 48.1% |
| Guamanians/Chamorros | 97.6 /100 | #83 | Exceptional 48.1% |
| Ukrainians | 97.6 /100 | #84 | Exceptional 48.1% |
| Immigrants | Israel | 97.4 /100 | #85 | Exceptional 48.0% |
| Belgians | 97.4 /100 | #86 | Exceptional 48.0% |
| Immigrants | Ireland | 97.3 /100 | #87 | Exceptional 48.0% |
| Afghans | 97.3 /100 | #88 | Exceptional 48.0% |
Demographics Similar to Italians by Married-couple Households
In terms of married-couple households, the demographic groups most similar to Italians are Scottish (49.0%, a difference of 0.020%), Immigrants from Asia (49.1%, a difference of 0.080%), Hungarian (49.1%, a difference of 0.11%), Iranian (49.0%, a difference of 0.11%), and Sri Lankan (49.0%, a difference of 0.11%).
| Demographics | Rating | Rank | Married-couple Households |
| Bhutanese | 99.8 /100 | #27 | Exceptional 49.3% |
| Germans | 99.8 /100 | #28 | Exceptional 49.2% |
| Maltese | 99.8 /100 | #29 | Exceptional 49.2% |
| Bolivians | 99.8 /100 | #30 | Exceptional 49.2% |
| Native Hawaiians | 99.8 /100 | #31 | Exceptional 49.1% |
| Hungarians | 99.8 /100 | #32 | Exceptional 49.1% |
| Immigrants | Asia | 99.7 /100 | #33 | Exceptional 49.1% |
| Italians | 99.7 /100 | #34 | Exceptional 49.0% |
| Scottish | 99.7 /100 | #35 | Exceptional 49.0% |
| Iranians | 99.7 /100 | #36 | Exceptional 49.0% |
| Sri Lankans | 99.7 /100 | #37 | Exceptional 49.0% |
| Greeks | 99.7 /100 | #38 | Exceptional 48.9% |
| Lithuanians | 99.6 /100 | #39 | Exceptional 48.9% |
| Immigrants | Bolivia | 99.6 /100 | #40 | Exceptional 48.9% |
| Immigrants | Lebanon | 99.6 /100 | #41 | Exceptional 48.9% |