Thai vs Immigrants from Belarus Family Households
COMPARE
Thai
Immigrants from Belarus
Family Households
Family Households Comparison
Thais
Immigrants from Belarus
67.2%
FAMILY HOUSEHOLDS
100.0/ 100
METRIC RATING
34th/ 347
METRIC RANK
63.7%
FAMILY HOUSEHOLDS
5.5/ 100
METRIC RATING
222nd/ 347
METRIC RANK
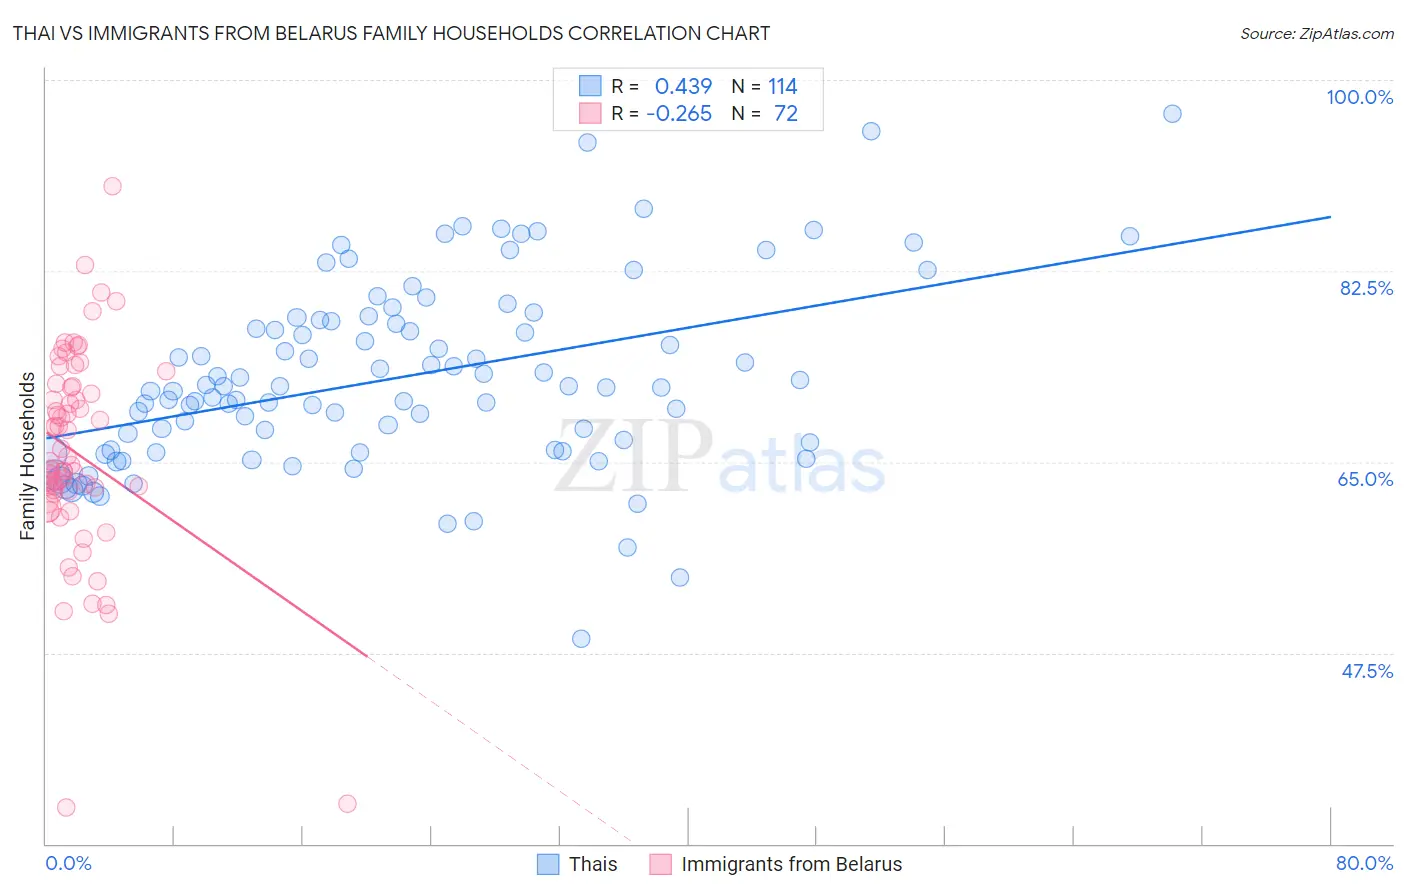
Thai vs Immigrants from Belarus Family Households Correlation Chart
The statistical analysis conducted on geographies consisting of 475,372,793 people shows a moderate positive correlation between the proportion of Thais and percentage of family households in the United States with a correlation coefficient (R) of 0.439 and weighted average of 67.2%. Similarly, the statistical analysis conducted on geographies consisting of 150,177,512 people shows a weak negative correlation between the proportion of Immigrants from Belarus and percentage of family households in the United States with a correlation coefficient (R) of -0.265 and weighted average of 63.7%, a difference of 5.5%.
Family Households Correlation Summary
| Measurement | Thai | Immigrants from Belarus |
| Minimum | 48.8% | 33.4% |
| Maximum | 97.0% | 90.2% |
| Range | 48.2% | 56.9% |
| Mean | 72.7% | 65.8% |
| Median | 71.8% | 64.9% |
| Interquartile 25% (IQ1) | 66.1% | 62.2% |
| Interquartile 75% (IQ3) | 77.9% | 71.9% |
| Interquartile Range (IQR) | 11.8% | 9.7% |
| Standard Deviation (Sample) | 8.6% | 9.5% |
| Standard Deviation (Population) | 8.5% | 9.4% |
Similar Demographics by Family Households
Demographics Similar to Thais by Family Households
In terms of family households, the demographic groups most similar to Thais are Salvadoran (67.2%, a difference of 0.0%), Nepalese (67.2%, a difference of 0.040%), Tohono O'odham (67.1%, a difference of 0.050%), Peruvian (67.1%, a difference of 0.060%), and Immigrants from Latin America (67.2%, a difference of 0.10%).
| Demographics | Rating | Rank | Family Households |
| Hispanics or Latinos | 100.0 /100 | #27 | Exceptional 67.4% |
| Hawaiians | 100.0 /100 | #28 | Exceptional 67.4% |
| Nicaraguans | 100.0 /100 | #29 | Exceptional 67.4% |
| Immigrants | Peru | 100.0 /100 | #30 | Exceptional 67.2% |
| Immigrants | Latin America | 100.0 /100 | #31 | Exceptional 67.2% |
| Nepalese | 100.0 /100 | #32 | Exceptional 67.2% |
| Salvadorans | 100.0 /100 | #33 | Exceptional 67.2% |
| Thais | 100.0 /100 | #34 | Exceptional 67.2% |
| Tohono O'odham | 100.0 /100 | #35 | Exceptional 67.1% |
| Peruvians | 100.0 /100 | #36 | Exceptional 67.1% |
| Tsimshian | 100.0 /100 | #37 | Exceptional 67.1% |
| Mexican American Indians | 100.0 /100 | #38 | Exceptional 67.0% |
| Immigrants | El Salvador | 100.0 /100 | #39 | Exceptional 67.0% |
| Guamanians/Chamorros | 100.0 /100 | #40 | Exceptional 66.6% |
| Immigrants | Bolivia | 100.0 /100 | #41 | Exceptional 66.6% |
Demographics Similar to Immigrants from Belarus by Family Households
In terms of family households, the demographic groups most similar to Immigrants from Belarus are French Canadian (63.7%, a difference of 0.010%), Immigrants from South Africa (63.7%, a difference of 0.030%), Immigrants from Europe (63.7%, a difference of 0.050%), Macedonian (63.7%, a difference of 0.060%), and Turkish (63.6%, a difference of 0.070%).
| Demographics | Rating | Rank | Family Households |
| Belgians | 7.6 /100 | #215 | Tragic 63.8% |
| Croatians | 7.3 /100 | #216 | Tragic 63.8% |
| Osage | 7.0 /100 | #217 | Tragic 63.7% |
| Marshallese | 6.9 /100 | #218 | Tragic 63.7% |
| Macedonians | 6.5 /100 | #219 | Tragic 63.7% |
| Immigrants | Europe | 6.4 /100 | #220 | Tragic 63.7% |
| Immigrants | South Africa | 5.9 /100 | #221 | Tragic 63.7% |
| Immigrants | Belarus | 5.5 /100 | #222 | Tragic 63.7% |
| French Canadians | 5.4 /100 | #223 | Tragic 63.7% |
| Turks | 4.5 /100 | #224 | Tragic 63.6% |
| Immigrants | Hungary | 4.3 /100 | #225 | Tragic 63.6% |
| Immigrants | Bahamas | 4.2 /100 | #226 | Tragic 63.6% |
| Trinidadians and Tobagonians | 4.1 /100 | #227 | Tragic 63.6% |
| Blackfeet | 3.6 /100 | #228 | Tragic 63.6% |
| Bulgarians | 3.4 /100 | #229 | Tragic 63.6% |