British vs Immigrants from Belarus Family Households
COMPARE
British
Immigrants from Belarus
Family Households
Family Households Comparison
British
Immigrants from Belarus
64.4%
FAMILY HOUSEHOLDS
61.6/ 100
METRIC RATING
162nd/ 347
METRIC RANK
63.7%
FAMILY HOUSEHOLDS
5.5/ 100
METRIC RATING
222nd/ 347
METRIC RANK
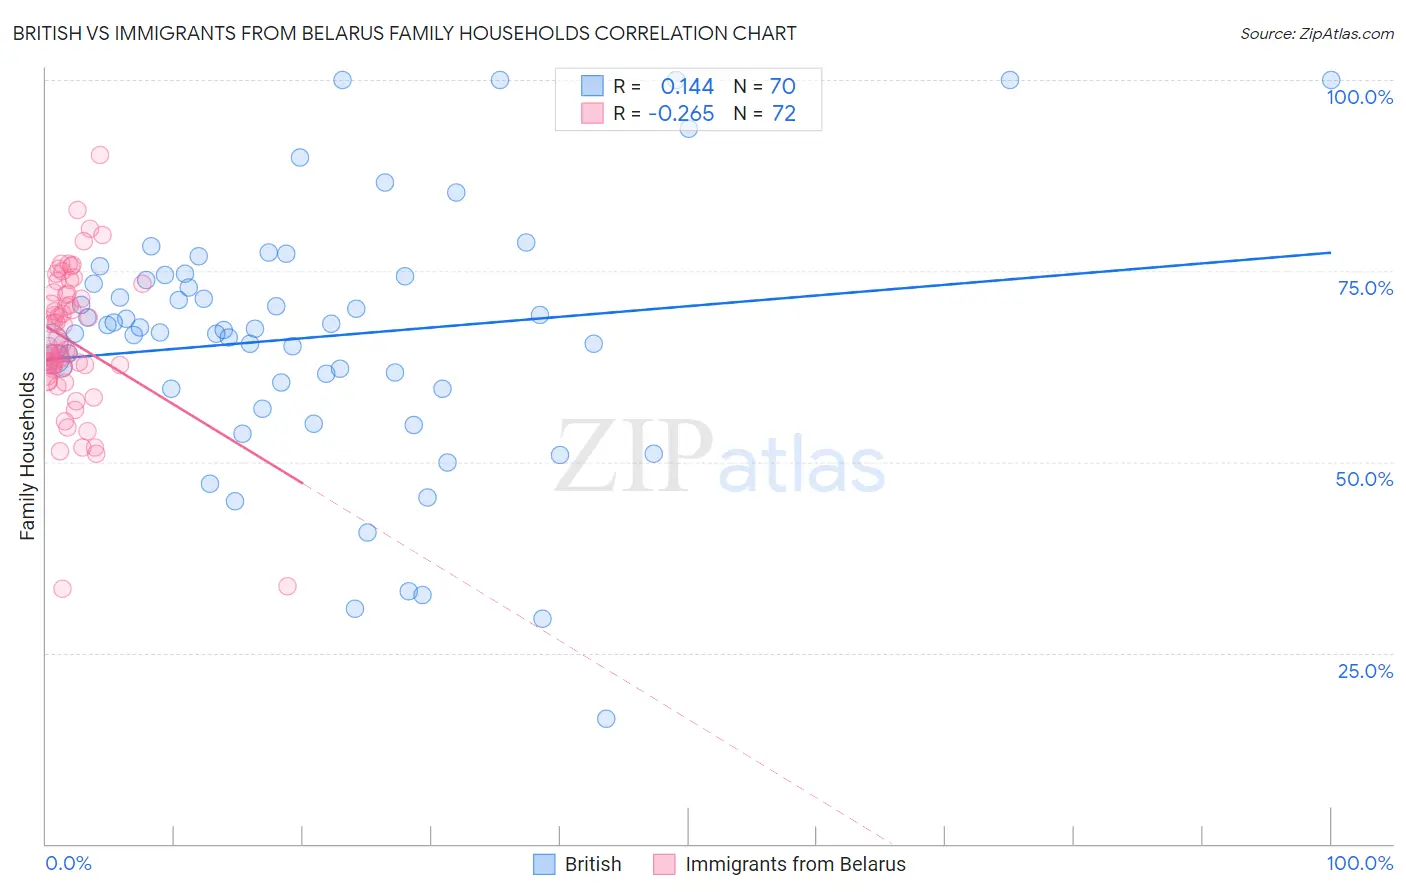
British vs Immigrants from Belarus Family Households Correlation Chart
The statistical analysis conducted on geographies consisting of 531,009,478 people shows a poor positive correlation between the proportion of British and percentage of family households in the United States with a correlation coefficient (R) of 0.144 and weighted average of 64.4%. Similarly, the statistical analysis conducted on geographies consisting of 150,177,512 people shows a weak negative correlation between the proportion of Immigrants from Belarus and percentage of family households in the United States with a correlation coefficient (R) of -0.265 and weighted average of 63.7%, a difference of 1.1%.
Family Households Correlation Summary
| Measurement | British | Immigrants from Belarus |
| Minimum | 16.4% | 33.4% |
| Maximum | 100.0% | 90.2% |
| Range | 83.6% | 56.9% |
| Mean | 66.4% | 65.8% |
| Median | 67.4% | 64.9% |
| Interquartile 25% (IQ1) | 59.6% | 62.2% |
| Interquartile 75% (IQ3) | 74.3% | 71.9% |
| Interquartile Range (IQR) | 14.8% | 9.7% |
| Standard Deviation (Sample) | 16.9% | 9.5% |
| Standard Deviation (Population) | 16.8% | 9.4% |
Similar Demographics by Family Households
Demographics Similar to British by Family Households
In terms of family households, the demographic groups most similar to British are Chickasaw (64.4%, a difference of 0.0%), Immigrants from England (64.4%, a difference of 0.010%), Immigrants from Nigeria (64.4%, a difference of 0.020%), Immigrants from Southern Europe (64.4%, a difference of 0.020%), and Scotch-Irish (64.4%, a difference of 0.030%).
| Demographics | Rating | Rank | Family Households |
| Uruguayans | 67.7 /100 | #155 | Good 64.5% |
| Czechs | 67.0 /100 | #156 | Good 64.5% |
| Canadians | 66.6 /100 | #157 | Good 64.4% |
| Lebanese | 66.4 /100 | #158 | Good 64.4% |
| Germans | 65.8 /100 | #159 | Good 64.4% |
| Immigrants | Moldova | 65.2 /100 | #160 | Good 64.4% |
| Immigrants | England | 62.6 /100 | #161 | Good 64.4% |
| British | 61.6 /100 | #162 | Good 64.4% |
| Chickasaw | 61.5 /100 | #163 | Good 64.4% |
| Immigrants | Nigeria | 60.1 /100 | #164 | Good 64.4% |
| Immigrants | Southern Europe | 60.0 /100 | #165 | Good 64.4% |
| Scotch-Irish | 59.2 /100 | #166 | Average 64.4% |
| Irish | 57.9 /100 | #167 | Average 64.4% |
| Hondurans | 57.5 /100 | #168 | Average 64.4% |
| Iraqis | 56.0 /100 | #169 | Average 64.4% |
Demographics Similar to Immigrants from Belarus by Family Households
In terms of family households, the demographic groups most similar to Immigrants from Belarus are French Canadian (63.7%, a difference of 0.010%), Immigrants from South Africa (63.7%, a difference of 0.030%), Immigrants from Europe (63.7%, a difference of 0.050%), Macedonian (63.7%, a difference of 0.060%), and Turkish (63.6%, a difference of 0.070%).
| Demographics | Rating | Rank | Family Households |
| Belgians | 7.6 /100 | #215 | Tragic 63.8% |
| Croatians | 7.3 /100 | #216 | Tragic 63.8% |
| Osage | 7.0 /100 | #217 | Tragic 63.7% |
| Marshallese | 6.9 /100 | #218 | Tragic 63.7% |
| Macedonians | 6.5 /100 | #219 | Tragic 63.7% |
| Immigrants | Europe | 6.4 /100 | #220 | Tragic 63.7% |
| Immigrants | South Africa | 5.9 /100 | #221 | Tragic 63.7% |
| Immigrants | Belarus | 5.5 /100 | #222 | Tragic 63.7% |
| French Canadians | 5.4 /100 | #223 | Tragic 63.7% |
| Turks | 4.5 /100 | #224 | Tragic 63.6% |
| Immigrants | Hungary | 4.3 /100 | #225 | Tragic 63.6% |
| Immigrants | Bahamas | 4.2 /100 | #226 | Tragic 63.6% |
| Trinidadians and Tobagonians | 4.1 /100 | #227 | Tragic 63.6% |
| Blackfeet | 3.6 /100 | #228 | Tragic 63.6% |
| Bulgarians | 3.4 /100 | #229 | Tragic 63.6% |