Pima vs Dutch West Indian Currently Married
COMPARE
Pima
Dutch West Indian
Currently Married
Currently Married Comparison
Pima
Dutch West Indians
35.9%
CURRENTLY MARRIED
0.0/ 100
METRIC RATING
347th/ 347
METRIC RANK
45.5%
CURRENTLY MARRIED
6.7/ 100
METRIC RATING
214th/ 347
METRIC RANK
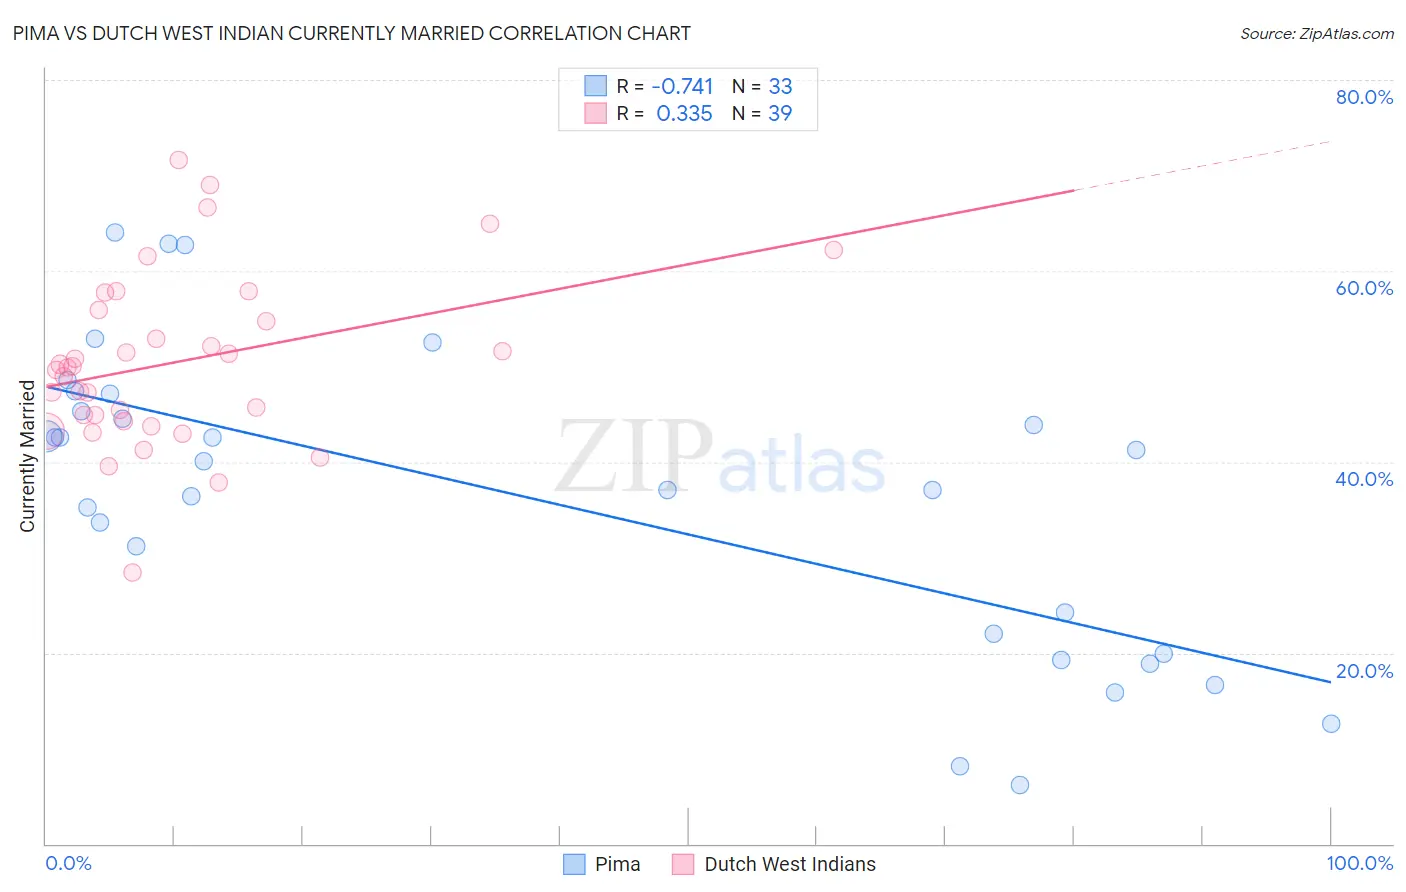
Pima vs Dutch West Indian Currently Married Correlation Chart
The statistical analysis conducted on geographies consisting of 61,552,342 people shows a strong negative correlation between the proportion of Pima and percentage of population currently married in the United States with a correlation coefficient (R) of -0.741 and weighted average of 35.9%. Similarly, the statistical analysis conducted on geographies consisting of 85,776,105 people shows a mild positive correlation between the proportion of Dutch West Indians and percentage of population currently married in the United States with a correlation coefficient (R) of 0.335 and weighted average of 45.5%, a difference of 26.7%.
Currently Married Correlation Summary
| Measurement | Pima | Dutch West Indian |
| Minimum | 6.2% | 28.4% |
| Maximum | 64.0% | 71.6% |
| Range | 57.8% | 43.2% |
| Mean | 36.3% | 50.4% |
| Median | 40.1% | 49.9% |
| Interquartile 25% (IQ1) | 21.0% | 44.3% |
| Interquartile 75% (IQ3) | 46.2% | 55.9% |
| Interquartile Range (IQR) | 25.2% | 11.6% |
| Standard Deviation (Sample) | 15.6% | 9.0% |
| Standard Deviation (Population) | 15.4% | 8.9% |
Similar Demographics by Currently Married
Demographics Similar to Pima by Currently Married
In terms of currently married, the demographic groups most similar to Pima are Hopi (36.5%, a difference of 1.8%), Tohono O'odham (36.8%, a difference of 2.4%), Immigrants from Cabo Verde (37.8%, a difference of 5.4%), Pueblo (38.2%, a difference of 6.5%), and Immigrants from Dominican Republic (38.9%, a difference of 8.4%).
| Demographics | Rating | Rank | Currently Married |
| Yup'ik | 0.0 /100 | #333 | Tragic 39.9% |
| Puerto Ricans | 0.0 /100 | #334 | Tragic 39.9% |
| Lumbee | 0.0 /100 | #335 | Tragic 39.8% |
| British West Indians | 0.0 /100 | #336 | Tragic 39.8% |
| Blacks/African Americans | 0.0 /100 | #337 | Tragic 39.6% |
| Cape Verdeans | 0.0 /100 | #338 | Tragic 39.6% |
| Dominicans | 0.0 /100 | #339 | Tragic 39.5% |
| Immigrants | Grenada | 0.0 /100 | #340 | Tragic 39.1% |
| Navajo | 0.0 /100 | #341 | Tragic 39.0% |
| Immigrants | Dominican Republic | 0.0 /100 | #342 | Tragic 38.9% |
| Pueblo | 0.0 /100 | #343 | Tragic 38.2% |
| Immigrants | Cabo Verde | 0.0 /100 | #344 | Tragic 37.8% |
| Tohono O'odham | 0.0 /100 | #345 | Tragic 36.8% |
| Hopi | 0.0 /100 | #346 | Tragic 36.5% |
| Pima | 0.0 /100 | #347 | Tragic 35.9% |
Demographics Similar to Dutch West Indians by Currently Married
In terms of currently married, the demographic groups most similar to Dutch West Indians are German Russian (45.5%, a difference of 0.0%), Alaska Native (45.5%, a difference of 0.040%), Marshallese (45.5%, a difference of 0.070%), Houma (45.5%, a difference of 0.080%), and Uruguayan (45.6%, a difference of 0.16%).
| Demographics | Rating | Rank | Currently Married |
| Immigrants | South America | 10.8 /100 | #207 | Poor 45.7% |
| Alsatians | 10.8 /100 | #208 | Poor 45.7% |
| Immigrants | Micronesia | 8.8 /100 | #209 | Tragic 45.6% |
| Uruguayans | 7.9 /100 | #210 | Tragic 45.6% |
| Houma | 7.2 /100 | #211 | Tragic 45.5% |
| Marshallese | 7.2 /100 | #212 | Tragic 45.5% |
| Alaska Natives | 7.0 /100 | #213 | Tragic 45.5% |
| Dutch West Indians | 6.7 /100 | #214 | Tragic 45.5% |
| German Russians | 6.7 /100 | #215 | Tragic 45.5% |
| Immigrants | Morocco | 5.5 /100 | #216 | Tragic 45.4% |
| Immigrants | Thailand | 5.1 /100 | #217 | Tragic 45.4% |
| Panamanians | 4.0 /100 | #218 | Tragic 45.3% |
| Immigrants | Portugal | 3.5 /100 | #219 | Tragic 45.2% |
| Kenyans | 3.1 /100 | #220 | Tragic 45.2% |
| Mexicans | 3.0 /100 | #221 | Tragic 45.2% |